
Figure 6. Effect of deleting the RT0 loop on biochemical activities of G2L4 and GII RTs.
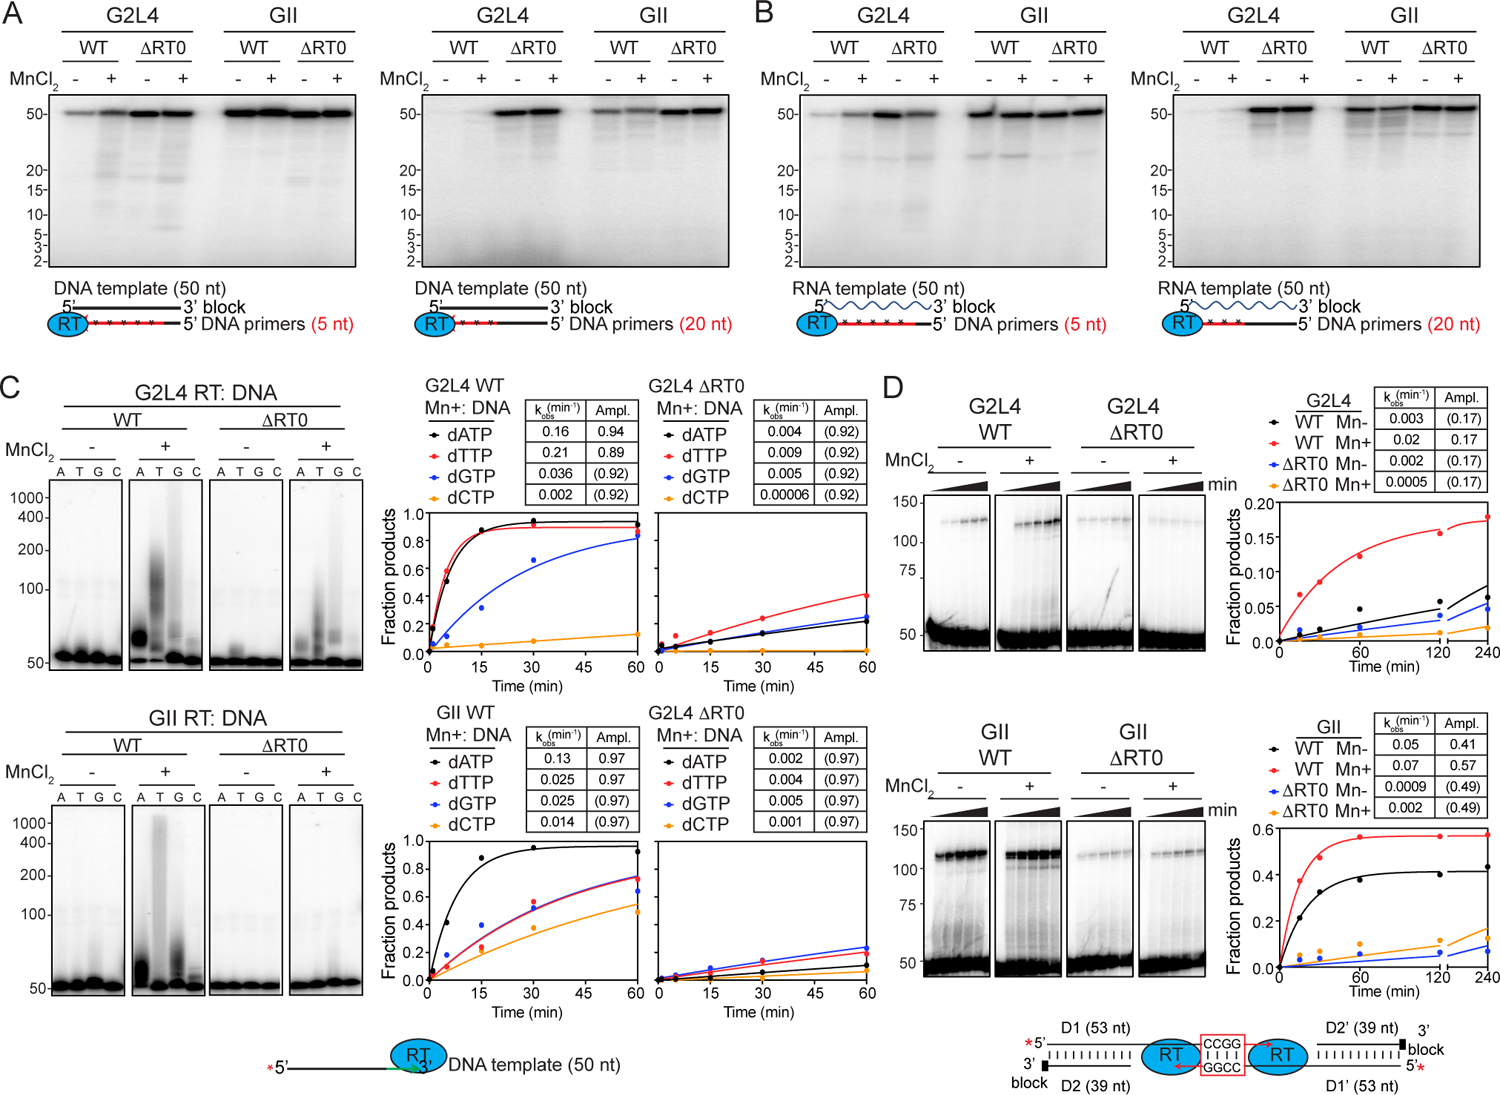
(A and B) Primer extension assays with 3’-blocked 50-nt DNA or RNA templates incubated for 20 min at 37°C.
(C) Terminal transferase assays. The gels (left) show a 20-min time point, and the plots (right) show time courses for gels shown in Figures S6E, S6F.
(D) MMEJ assays using DNA substrates with CCGG-3’ microhomologies.
The Tables shows kinetic paraments calculated as described in the legends of Figures 3 to 5. The numbers to the left of the gels indicate the positions of size markers in a parallel lane.