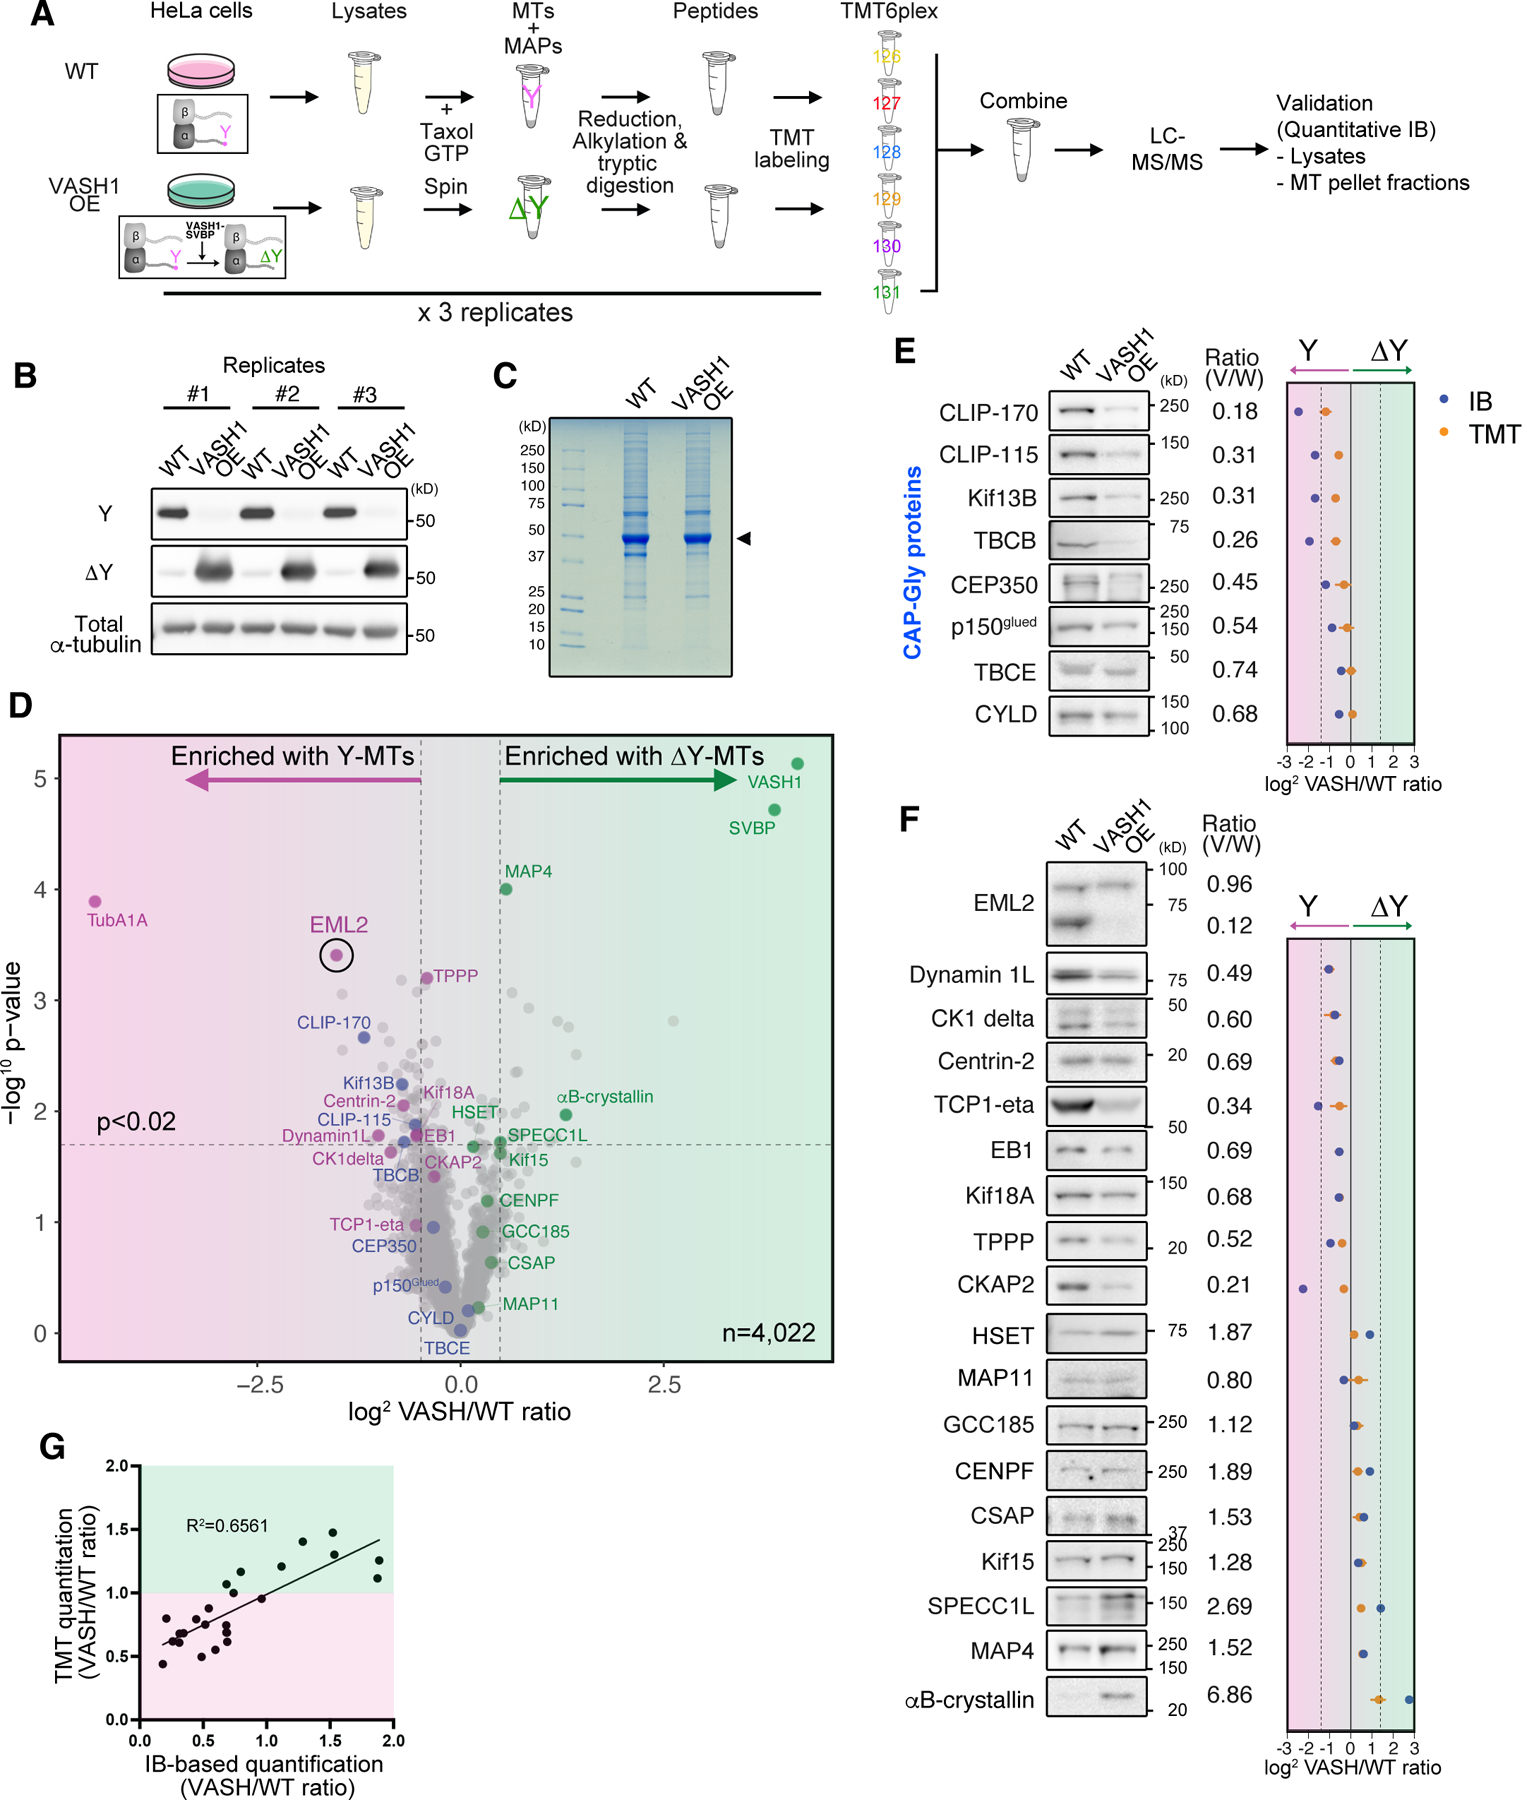
Fig. 1. A screening pipeline to identify candidate proteins that discriminate between the Y/ΔY-αCTT state of microtubules.

(A) Schematic of the Y/ΔY reader screen. MTs, microtubules, IB, immunoblot analysis. (B) Immunoblot analysis for tubulin Y/ΔY state in the microtubule pellet fractions prepared from wild-type and HeLa cells overexpressing VASH1-SVBP. (C) SDS-PAGE analysis of microtubule pellet fractions. Arrowhead indicates tubulin. (D) Volcano plot depicting proteins co-sedimented with Y- or ΔY-microtubules shown in magenta or green background, respectively. X axis represents log2 relative abundance of each protein in VASH1 OE over wild-type samples (VASH/WT). Y axis shows -log10 p-value. Thresholds of 1.4 (x axis) and 0.02 (y axis) are indicated by dotted lines. Blue dots highlight CAP-Gly proteins. Magenta and green dots represent proteins enriched with Y- and ΔY-readers, respectively. (E and F) Immunoblot analysis of CAP-Gly proteins (E) and Y/∆Y-reader candidates (F) in microtubule pellet fractions. Relative intensity of the bands of VASH1 OE over WT samples (normalized against corresponding total ɑ-tubulin band intensity) is shown next to each blot as well as in the graphs at the right (blue dots). In the same graphs, relative abundance of each hit calculated from the TMT analysis was indicated by orange dot with error bar (SD, n = 3). (G) Comparison of TMT- and immunoblot-based quantitation of relative protein abundance in microtubule pellet fractions. Background color indicates Y-enrichment (magenta) and ΔY-enrichment (green) based on the TMT analysis.
See also Figures S1 and S2 and Data S1.
