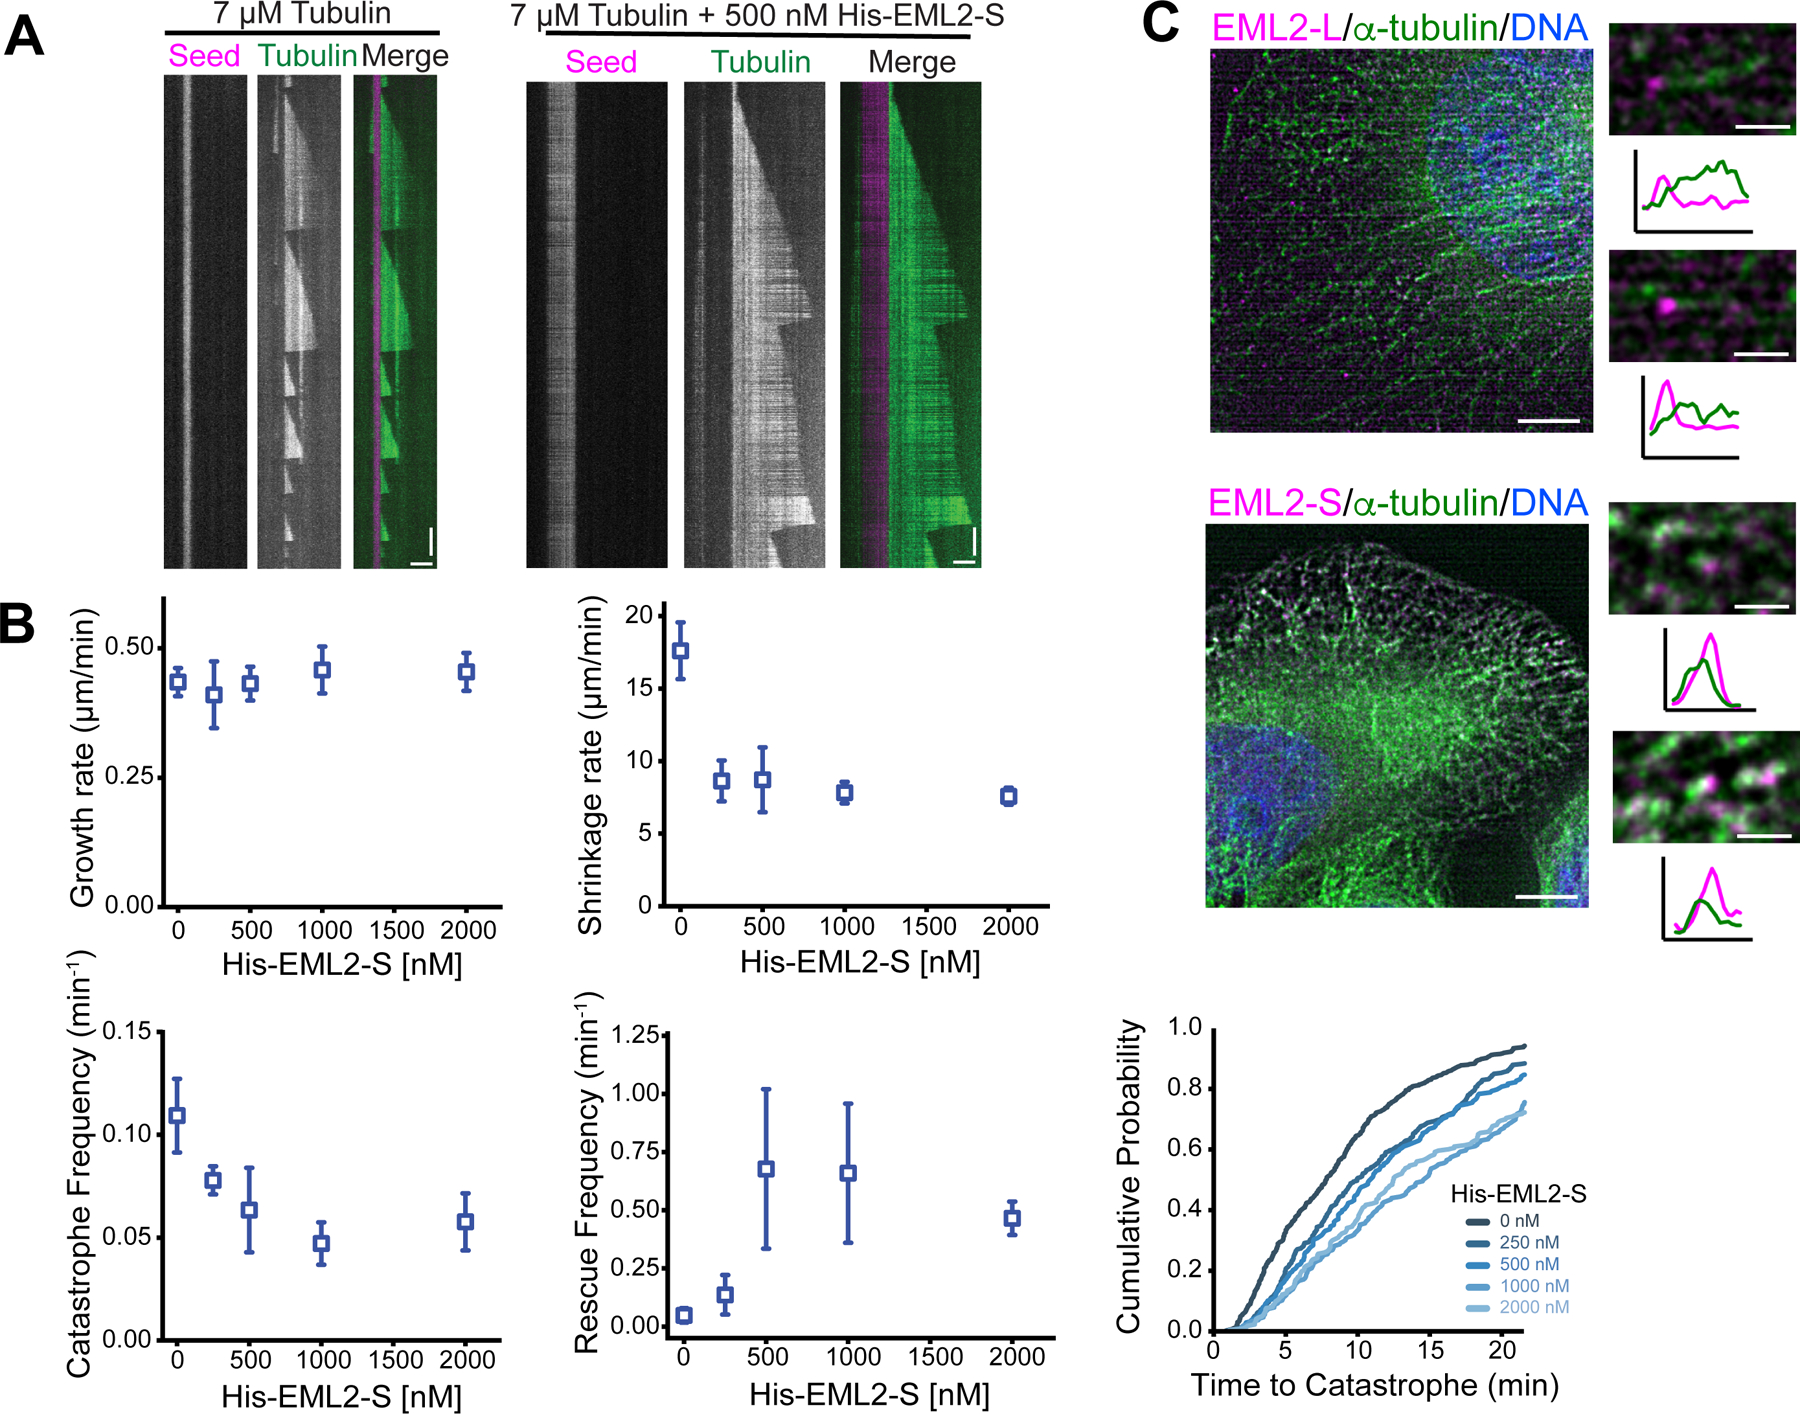
Fig. 5. EML2-S is a MAP that stabilizes microtubules.

(A) In vitro microtubule dynamics assay using a constant concentration of brain tubulin (7 µM) with or without purified His-EML2-S. Seeds are shown in magenta and dynamic microtubules in green. Vertical bars, 3 min; horizontal bars, 3 µm. (B) Measurements of dynamics parameters. Mean ± SD (from 3–5 independent experiments). (C) Immunofluorescent staining of PA-EML2-L and S in HeLa cells briefly exposed to nocodazole. Boxed regions were enlarged and shown with line profiles analyzed along each microtubule. Arrowheads indicate EML2 enriched at microtubule ends. Magenta, PA-tagged EML2 (L/S); green, ɑ-tubulin; blue, DNA. Bars, 5 µm (whole cell images) and 1 µm (enlarged images).
See also Figure S6.
