
Fig. 6. mNeonGreen-tagged EML2-L tracks shrinking microtubule plus ends and slows the microtubule shrinkage rate.
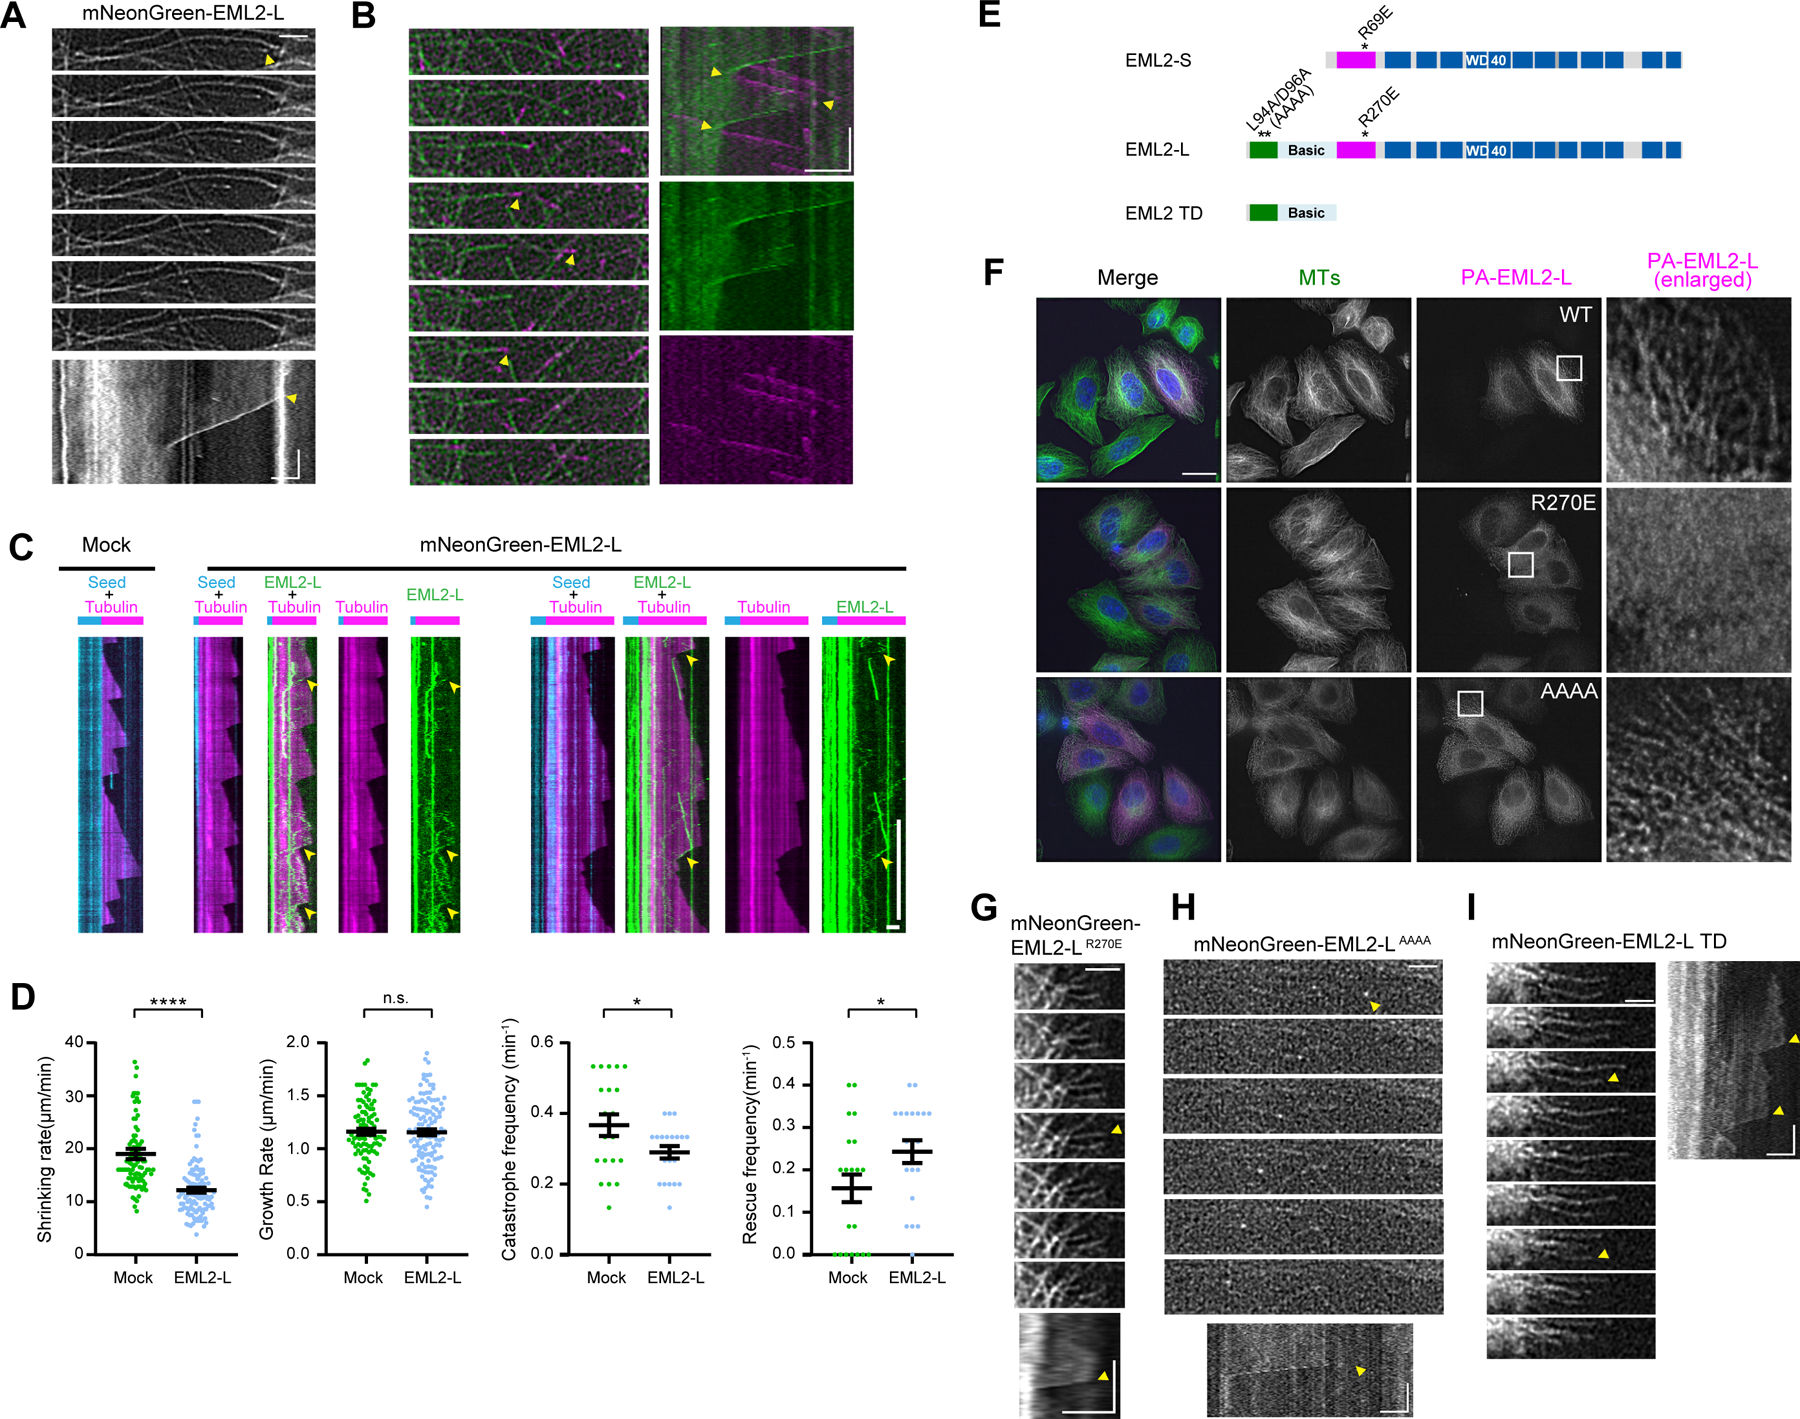
(A) Time lapse images and kymograph of mNG-EML2-L enriched at shortening microtubule ends in HeLa cells. Arrowheads mark the position of shortening microtubule ends. Yellow arrowheads indicate the beginning of a microtubule shortening event. Vertical bar, 30 s; horizontal bars, 2 µm. (B) Time lapse images and kymograph of mNG-EML2-L and EB3-mCherry co-expressed in HeLa cells. Arrowheads mark the position of microtubule ends. Rescue and catastrophe are indicated by yellow arrowheads. Vertical bar, 30 s; horizontal bars, 2 µm. (C) In vitro microtubule dynamics assay with lysates prepared from COS7 cells expressing mNG-EML2-L. Cyan, microtubule seeds; magenta, dynamic microtubules; green, mNG-EML2-L. Vertical bars, 5 min; horizontal bars, 2 µm. Arrowheads indicate enrichment of EML2-L at a shrinking microtubule end. (D) Quantification of the microtubule dynamics. n=~100 events for shrinking rate and growth rate analysis. n=~20 events for catastrophe frequency and rescue frequency analysis from 2–3 independent experiments. Mean ± SEM. *, p<0.05; ****, p <0.001 and n.s., not significant (two-tailed t test) (E) Schematic of EML2-L residues targeted for mutagenesis and truncation. One of the EML2-S mutants analyzed in Fig. 4 (R69E) is shown as a reference. (F) Immunofluorescence of HeLa cells overexpressing PA-tagged mutant EML2-L proteins. Scale bars, 20 µm (whole cell images) and 5 µm (enlarged images). (G-I) Time lapse images and kymograph of mNG-EML2-L R270 (G), mNG-EML2-L AAAA (H) and mNG-EML2-L TD proteins (I). Arrowheads mark the position of shrinking microtubule ends. Yellow arrowheads indicate the beginning of microtubule shortening events. Vertical bar, 30 s; horizontal bars, 2 µm.