
Fig. 1. Identification of c-Rel-dependent monocytes by single-cell RNA sequencing.
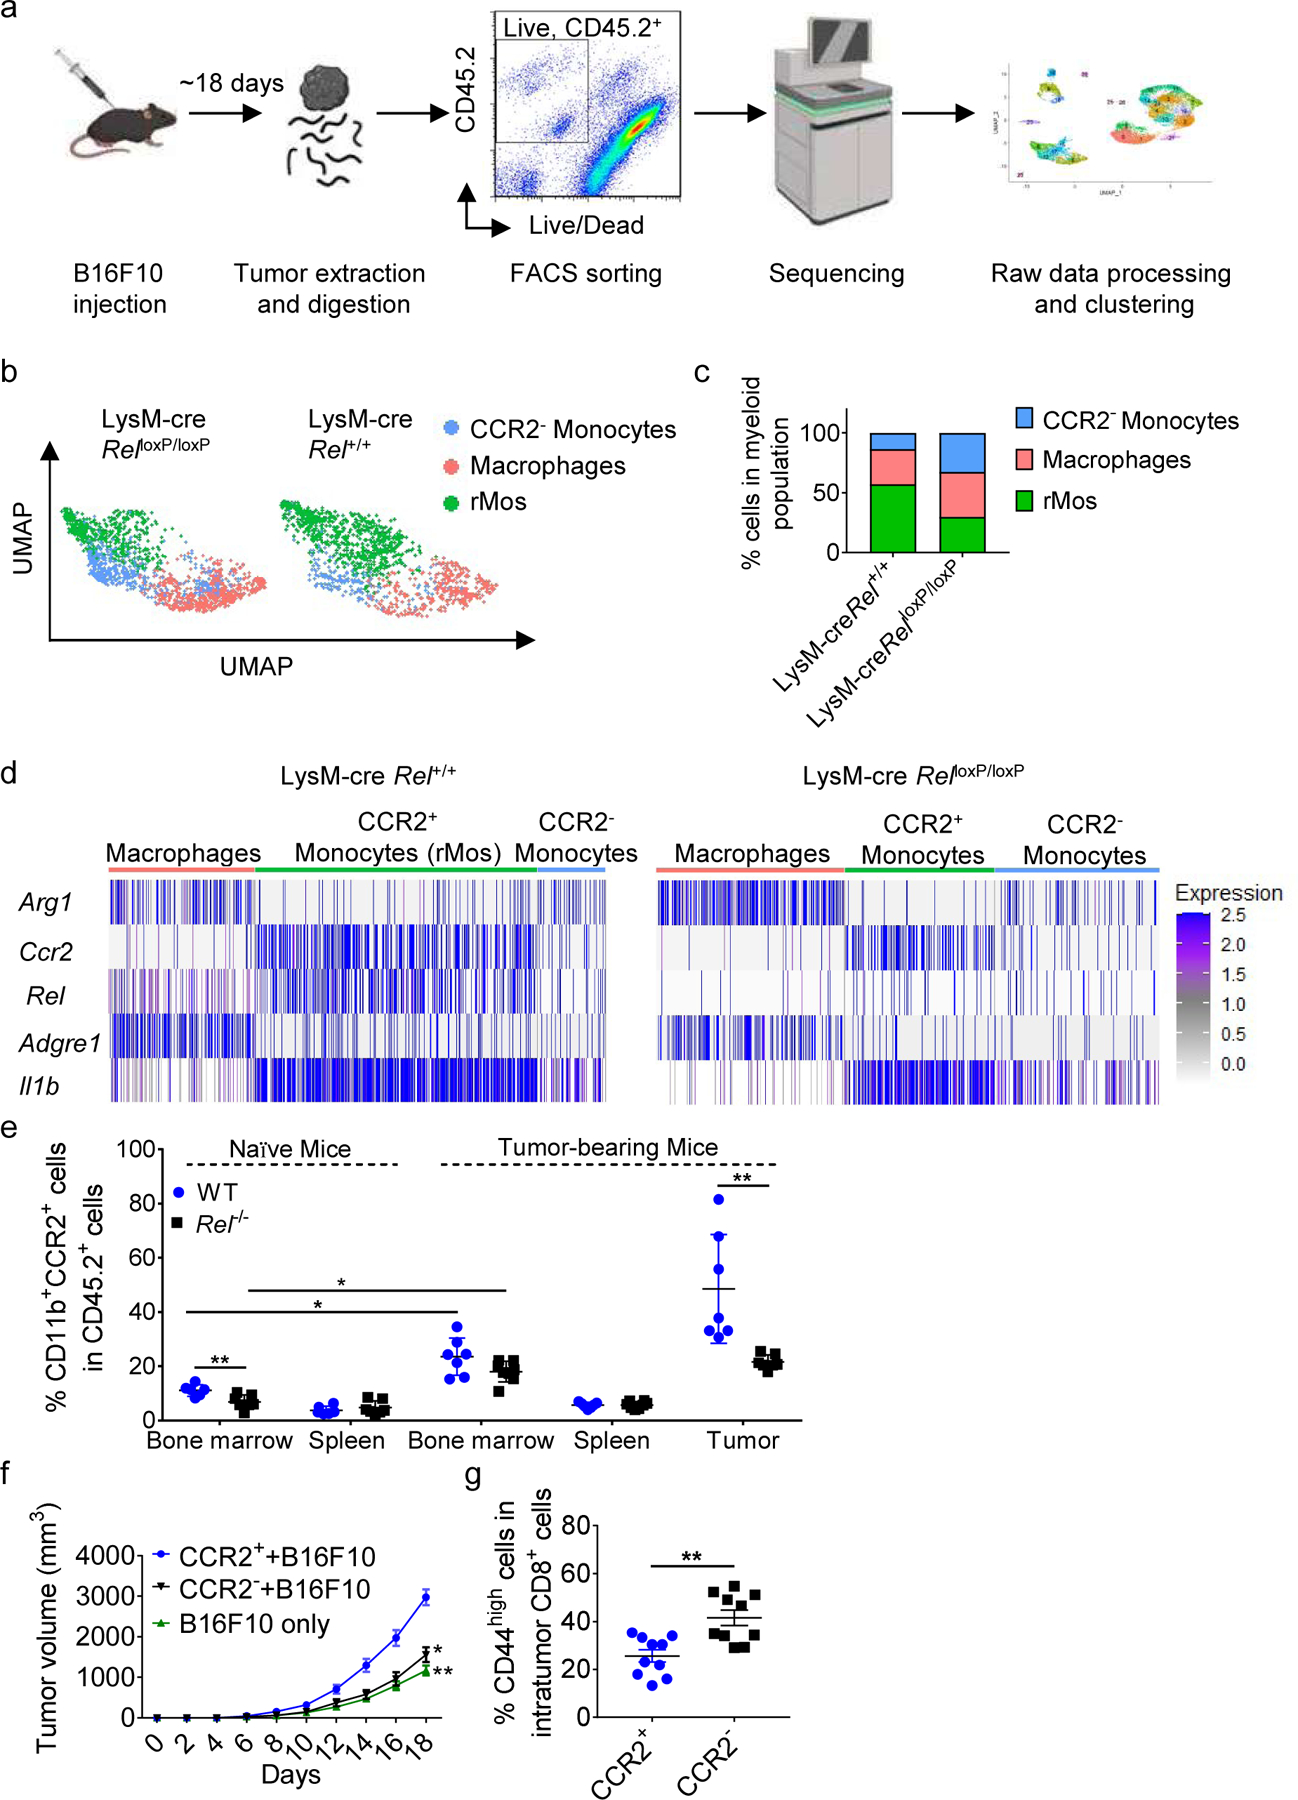
a, Workflow for scRNA-seq of viable CD45.2+ cells isolated by FACS from LysM-cre × Rel+/+ and LysM-cre × RelloxP/loxP mice harboring similarly sized B16F10 tumors (n=5 mice/group).
b, UMAP plots of 2830 intratumor myeloid cells that were selected for subsequent analyses. Each dot of the UMAP plot represents a single cell. Cell clusters are color-coded by associated cell types. c, Percentages of myeloid cell types inferred by Panel b.
d, Heatmap showing indicated gene expression across myeloid clusters.
e, Percentages of CD11b+CCR2+ cells in the indicated tissues of naïve and B16F10 tumor-bearing WT and Rel−/− mice, as determined by flow cytometry; for naïve mice: WT, n=6 mice, Rel−/−, n=7 mice; for tumor-bearing mice: WT, n=7 mice, Rel−/−, n=8 mice.
f, Tumor growth in WT mice injected s.c. with B16F10 tumor cells plus CCR2+(rMo)/CCR2− monocytes (n = 10 mice/group).
g, Percentages of CD44high cells in intratumor CD8+ cells in f, as determined by flow cytometry. Statistical significance was determined by a two-tailed unpaired t-test. Data are presented as means ± s.e.m. (e-f), and pooled from two independent experiments (e) (*, P<0.05; **, P<0.01).