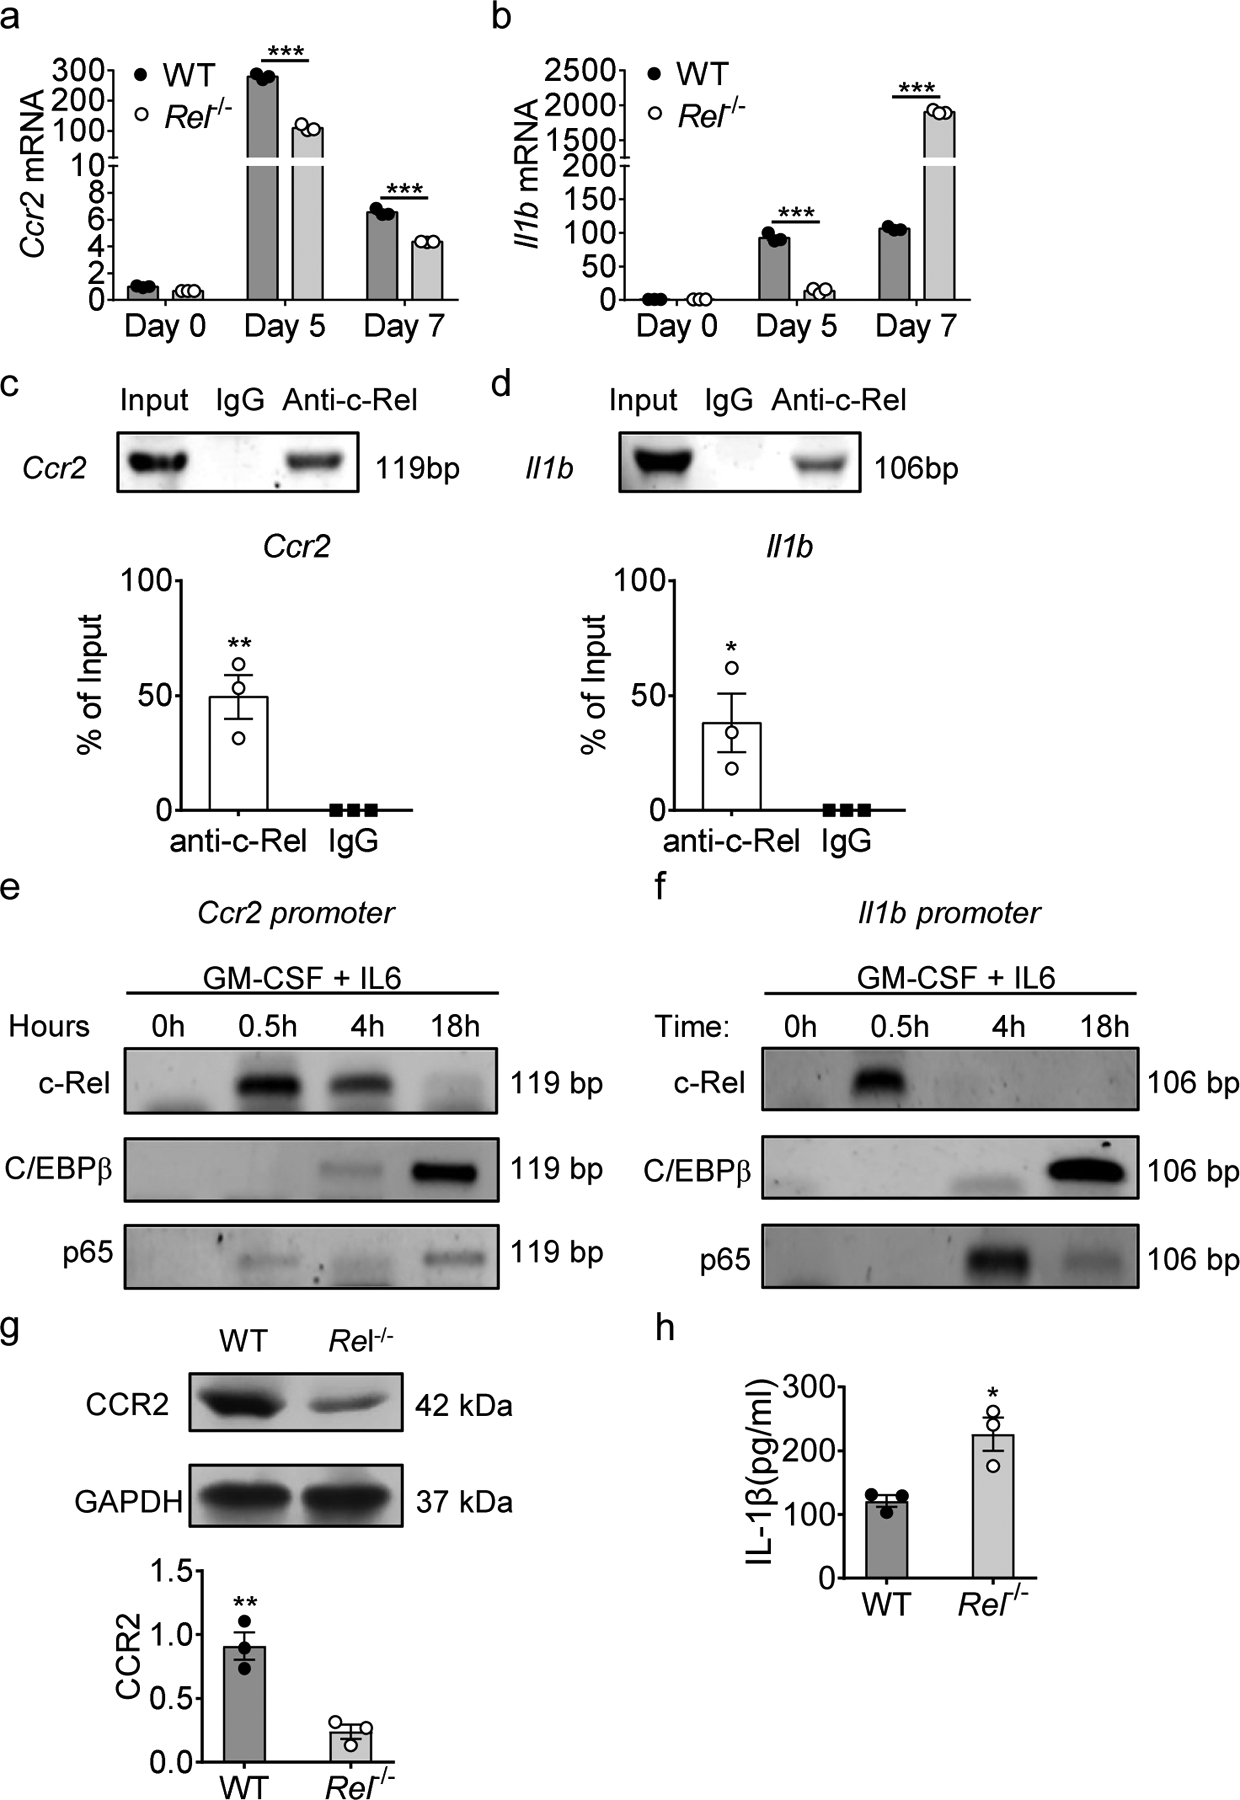
Fig. 3. Regulation of rMo signature genes by the c-Rel enhanceosome.

a, b, Relative mRNA levels of Ccr2 (a) and Il1b (b) in bone marrow-derived MDSCs of WT and Rel−/− mice, determined by real-time RT-PCR. (n=3 /group; ***, P<0.001).
c, d, c-Rel binding to the Ccr2 (c) and Il1b (d) gene promoter regions in bone marrow-derived MDSCs as determined by chromatin immunoprecipitation assays (ChIP). Control IgG and input DNA are shown as controls. The bar graph shows the relative c-Rel binding to the Ccr2 gene promoter region compared with input. (*, P<0.05; **, P<0.01)
e, f, The binding kinetics of c-Rel, C/EBPβ, and p65 to the Ccr2 (e) and Il1b (f) gene promoters in cultured bone marrow cells treated with GM-CSF and IL-6 for up to 18 hours as determined by ChIP.
g, CCR2 protein expression in splenic Gr-1+ cells isolated from Rel−/− and WT B16F10 tumor-bearing mice as determined by Western blot (n=3/group) (g). The bar graph shows the relative quantities of the CCR2 protein in the corresponding lane shown left (**, P<0.01;).
h, IL-1β protein in the media of bone marrow-derived MDSCs of WT and Rel−/− mice as determined by ELISA. Statistical significance was determined by two-tailed unpaired t-test (a-d, g,h). Data are presented as means ± s.e.m. (a-d, g,h), and experiments were repeated 2 times independently with similar results; data of one representative experiment are shown.
