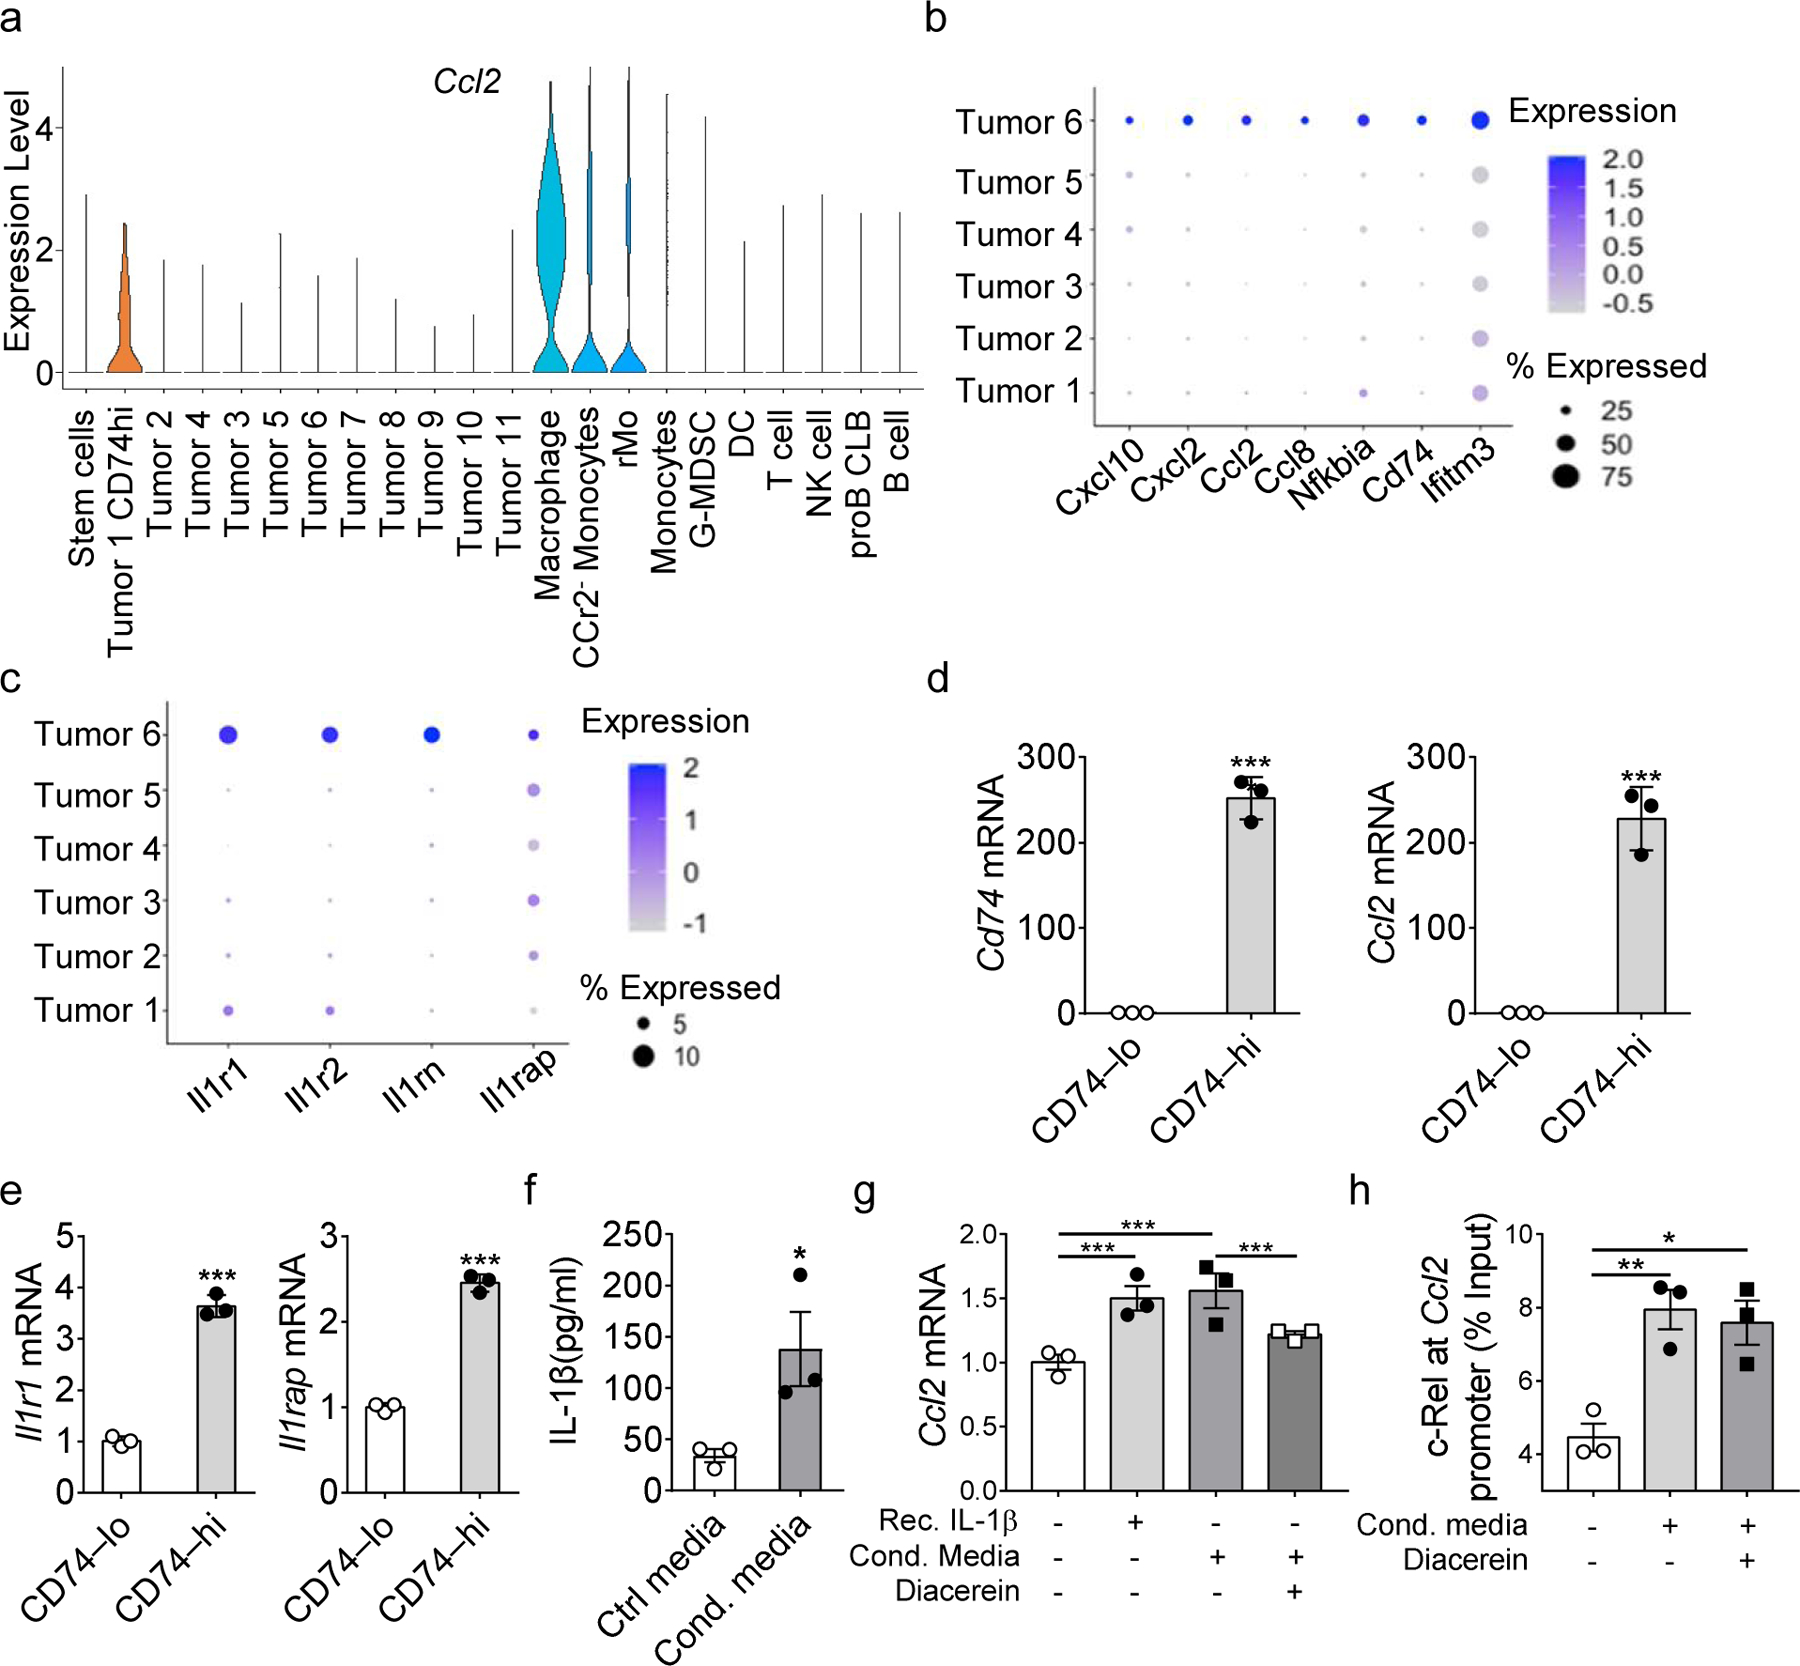
Fig. 4. IL-1β and Ccl2 crosstalk between rMos and tumor cells.

a, Violin plots showing Ccl2 gene expression in tumor clusters and immune clusters.
b, c, Bubble plot showing the expression of indicated chemokines (b) and Il1-receptor family proteins (c) across different tumor clusters.
d, e, Relative mRNA levels of Cd74, Ccl2 (d) and Il1r1, Il1rap (e) between CD74hi and CD74lo tumor cells as determined by real-time RT-PCR.
f, IL-1β secreted in the conditioned media of MDSC cultures compare with control media as determined by ELISA.
g, h, Relative Ccl2 mRNA level of B16F10 cells (g) and Raw264.7 cells (h) with indicated treatments as determined by real-time RT-PCR.
i, j, Bar graphs show the relative c-Rel binding to the Ccl2 gene promoter region in B16F10 cells (i) and Raw264.7 cells (j) with indicated treatments compared with input as determined by ChIP. Statistical significance was determined by two-tailed unpaired t-test (d-f) and one-way ANOVA with Tukey post-hoc test (g-j). For panel d-j, data are presented as means ± s.e.m., and experiments were repeated 2 times independently with similar results; data of one representative experiment are shown.
