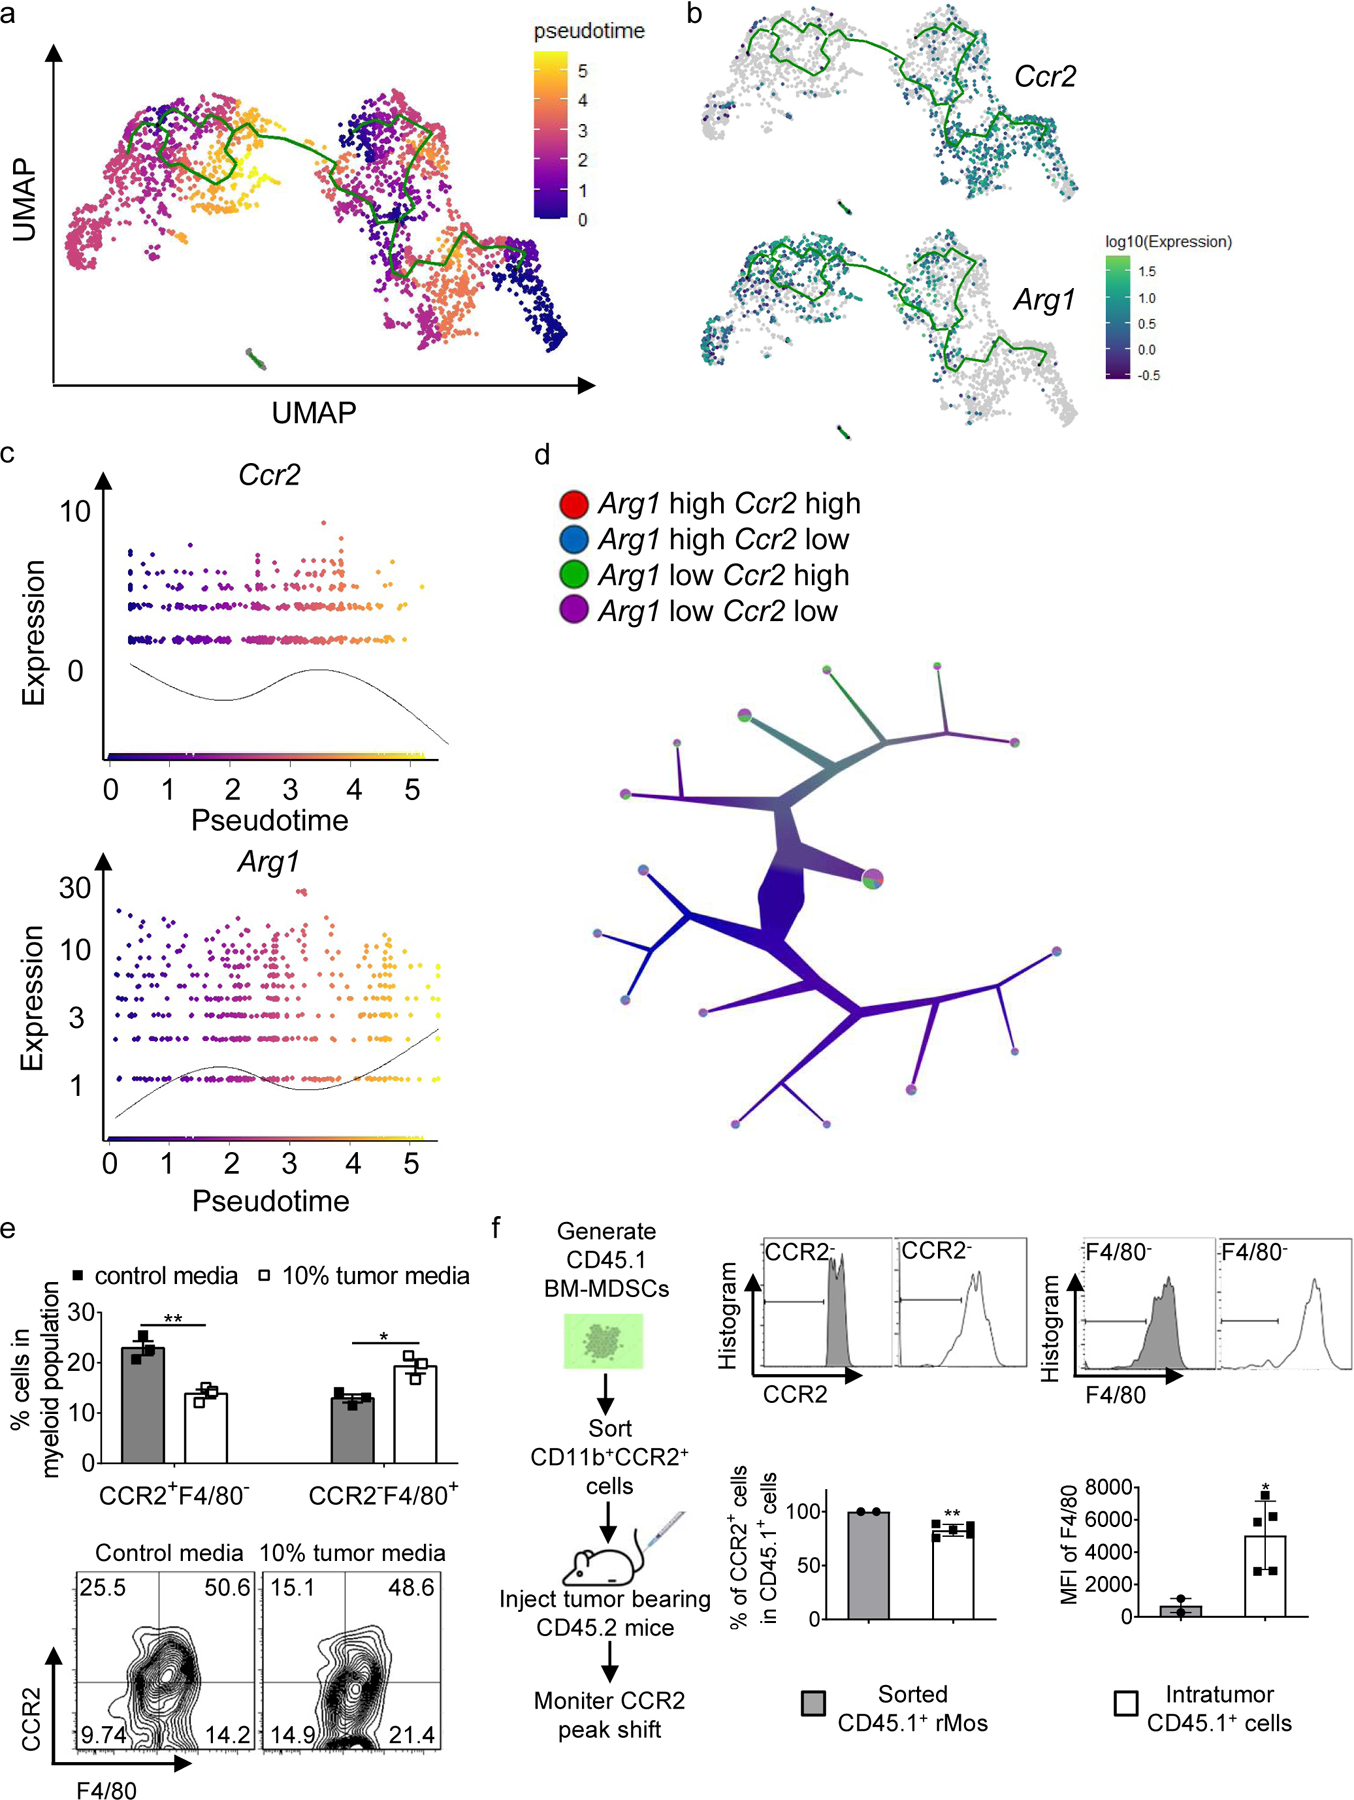
Fig. 5. The relationship between rMos and TAMs in TME.

a, Monocle analysis on Myeloid populations resulted in branched trajectory with 6 distinct Monocle states (color code for each state is indicated).
b, Ccr2 and Arg1 expression levels along the branched trajectory.
c, Pseudotime plot illustrating expression of Ccr2 and Arg1 genes over pseudotime.
d, Color-coded tree with the expression level of Ccr2 and Arg1 by TooManyCells analysis.
e, Percentages of indicated cell subsets in BM-MDSCs cultured with control media or 10% tumor cell-conditioned media as determined by flow cytometry (n=3 samples/group).
f, Adoptive transfer experiment flowchart (left), stacked histograms (upper right), and bar graph (lower right) showing CCR2 and F4/80 levels in sorted CD45.1+ cells (pooled from 8 donor mice) and CD45.1+ cells in the tumors of recipient mice (n=5 mice).
Statistical significance was determined by two-tailed unpaired t-test (e and f). Data are presented as means ± s.e.m. For panel e, experiments were repeated 2 times independently with similar results, and data of one representative experiment are shown. For panel f, data are pooled from two independent experiments.
