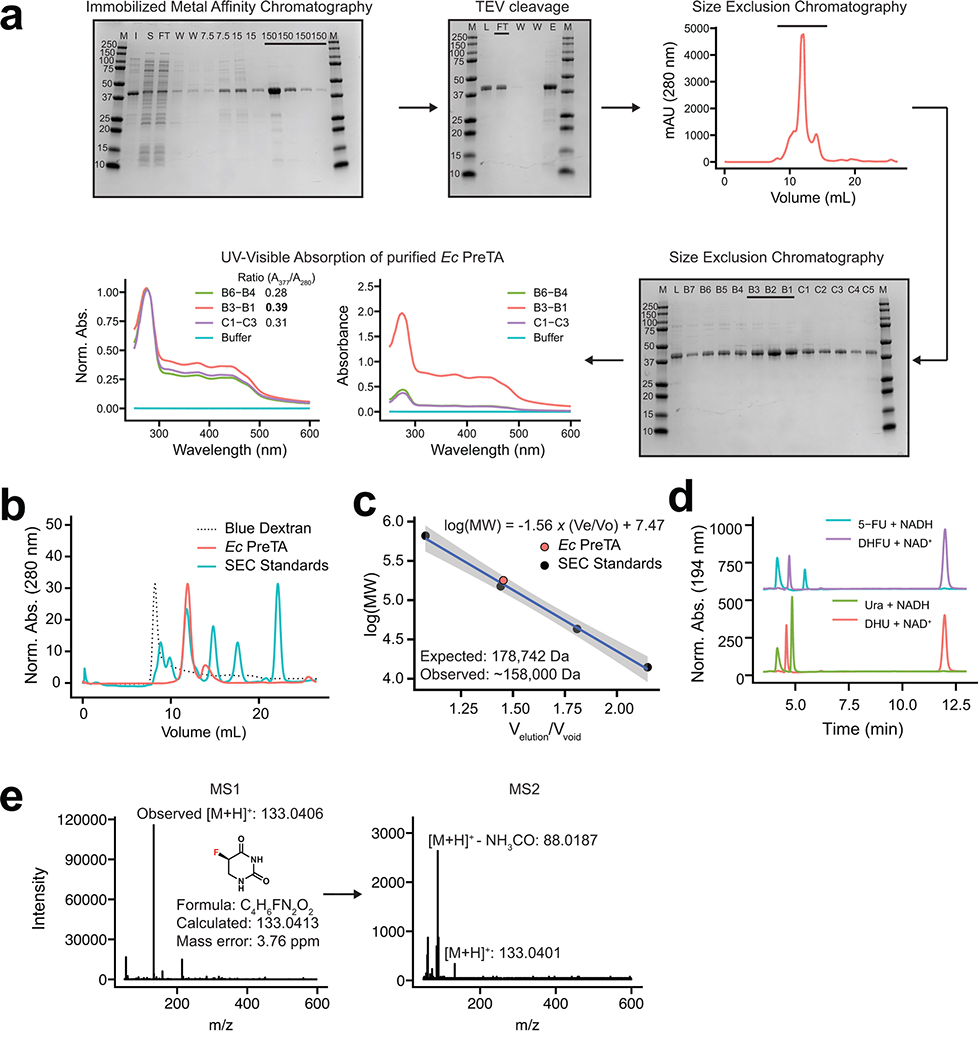
Extended Data Fig. 4. Purification and biochemical characterization of E. coli PreTA.
(a) Purification workflow for E. coli PreTA including immobilized metal affinity chromatography (M: marker, I: insoluble fraction, S: soluble fraction, FT: flowthrough, W: wash, numbers across the top indicate imidazole concentration), TEV cleavage (M: marker, L: loaded, FT: flowthrough, W: wash, E: elute), size exclusion chromatography (M: marker, L: loaded, lanes are labeled by fraction from a 96 well plate collected via FPLC), and by UV-visible absorption spectroscopy where normalizing protein levels showed a ratio of greater than 0.35 for A280/A377 indicated holoenzyme. In all gels, numbers down the side indicate protein molecular weight in kDa and solid lines indicate lanes that were carried forward in the preparation. (b-c) Analytical size exclusion chromatography (SEC) traces (b) and analysis (c), characterizing the main peak as a heterotetramer. Grey shaded region indicates 95% confidence intervals of the linear model. (d) High pressure liquid chromatography (HPLC) of NADH, uracil (Ura), dihydrouracil (DHU), NAD+, 5-fluorouracil (5-FU), and dihydrofluorouracil (DHFU). (e) Liquid Chromatography Mass Spectrometry (LC-MS/MS) of enzymatic reaction with 5-FU confirms the presence of the exact mass of DHFU.

