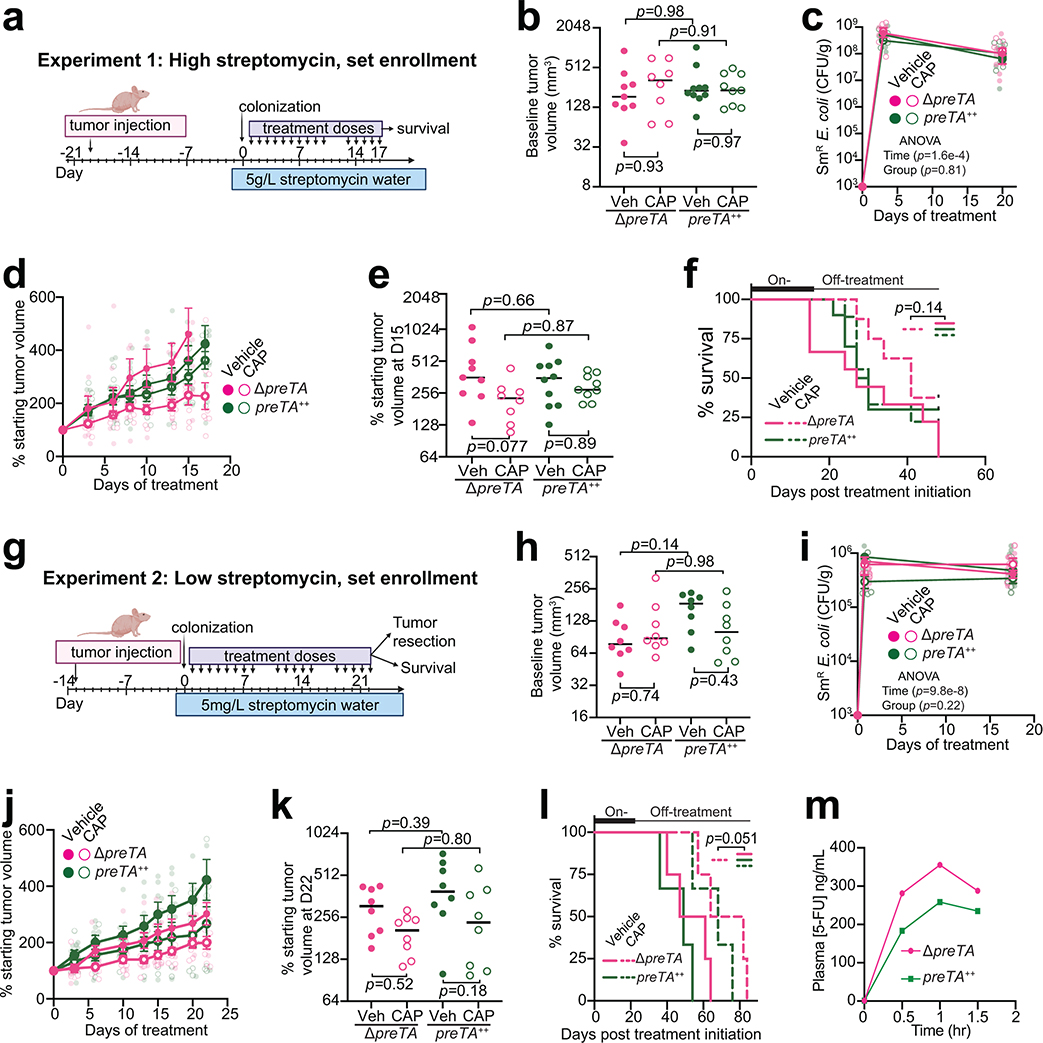
Extended Data Fig. 5. PreTA decreases the efficacy and oral bioavailability of capecitabine (CAP).
(a, g) Xenograft experiment (expt) 1 and 2 design, respectively. (b, h) Pre-treatment tumor volumes: (b) expt1, (h) expt2 (n=8 mice ΔpreTA-CAP; n=10 mice preTA++-Veh; n=9 mice/group remainder expt1; n=8 mice/group expt2; lines represent medians; 2-way ANOVA with Tukey’s correction). (c, i) Colonization levels of streptomycin-resistant (SmR) E. coli in colony-forming units (CFU)/gram stool in (c) expt1 and (i) expt2 (n=6 mice/group expt1; n=8 mice/group expt2; opaque dots and lines represent mean±SEM; 2-way ANOVA with Tukey’s correction). Zero values at baseline replaced with our limit of detection (1000 CFU/g). (d, j) Percentage of starting tumor volumes over time in (d) expt1 and (j) expt2 (n=8 mice ΔpreTA-CAP group; n=10 mice preTA++-Veh; n=9 mice/group remainder expt1; n=8 mice/group expt2; opaque dots and lines represent mean±SEM; 2-way ANOVA with Tukey’s correction did not reach significance). (e, k) Percentage of starting tumor volumes on (e) day 15 expt1 and (k) day 22 expt2 (n=8 mice ΔpreTA-CAP group; n=10 mice preTA++-Veh; n=9 mice/group remainder expt1; n=8 mice/group expt2; timepoints selected to capture all mice prior to euthanasia; lines represent medians; 2-way ANOVA with Tukey’s correction). (f, l) Percentage of mice reaching the humane endpoint in (f) expt1 and (l) expt2 (expt1: n=8 mice ΔpreTA-CAP group; n=10 mice preTA++-Veh; n=9 mice/group remainder; expt2: n=3 preTA++ groups, n=4 ΔpreTA groups; log-rank Mantel-Cox test comparing ΔpreTA-CAP to all other groups. 8 mice were censored (black boxes) as they did not reach the endpoint in expt1. (m) LC-QTOF/MS quantification of 5-FU from pooled plasma samples following 500 mg/kg CAP administration in mice (same design as Fig. 4g; n=5 mice/group pooled into n=1 sample/group).

