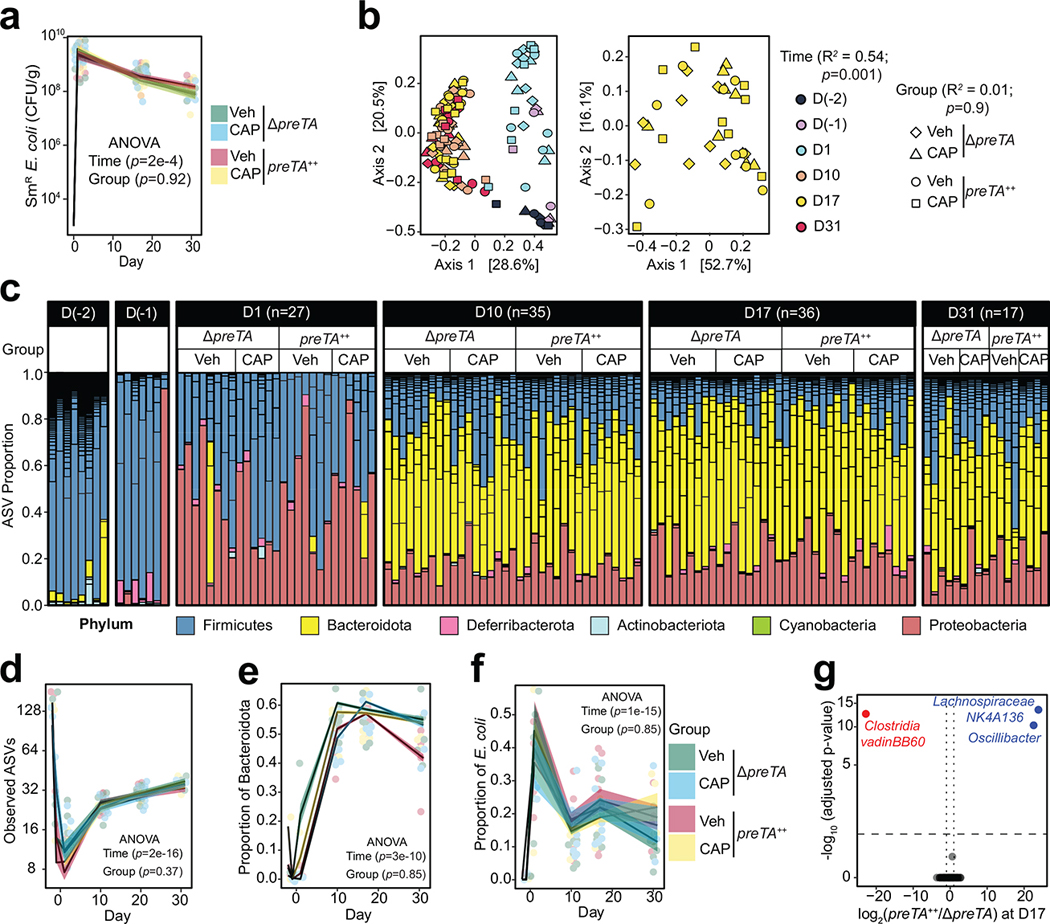
Extended Data Fig. 6. Consistent shifts in the gut microbiota across groups.
(a) Quantification of streptomycin-resistant (SmR) E. coli in feces across time (n=11 mice for for preTA++-Veh group and n=10 mice/group for the rest; 2-way ANOVA test with Tukey’s correction; lines and ribbons represent mean±SEM). Zero values at baseline replaced with our limit of detection (1000 CFU/g). (b) Principal coordinate analysis of fecal microbiota from mice treated with CAP or vehicle (Veh) and colonized with ΔpreTA or preTA++ E. coli across time (Bray-Curtis distance matrix, permutational multivariate analysis of variance test with Benjamini-Hochberg correction using ADONIS statistical package). (c) Microbial community composition at the phylum level. Each bar represents stool from each mouse. Short horizontal lines within bars represent different amplicon sequence variants (ASV). (d) Number of ASVs over time for each treatment group (exact n values indicated in panel c; 2-way ANOVA with Tukey’s correction; lines and ribbons represent mean±SEM). (e, f) Proportion of (e) Bacteroidota and (f) E. coli over time for each treatment group (exact n values indicated in panel c; 2-way ANOVA with Tukey’s correction; lines and ribbons represent mean±SEM). (g) Volcano plots of differentially abundant sequence variants at day 17 (FDR<0.1, |log2 fold-change|>1, Wald test with Benjamini-Hochberg correction, significance limits are marked with dash lines). Blue and red texts represent enriched and depleted taxa, respectively.

