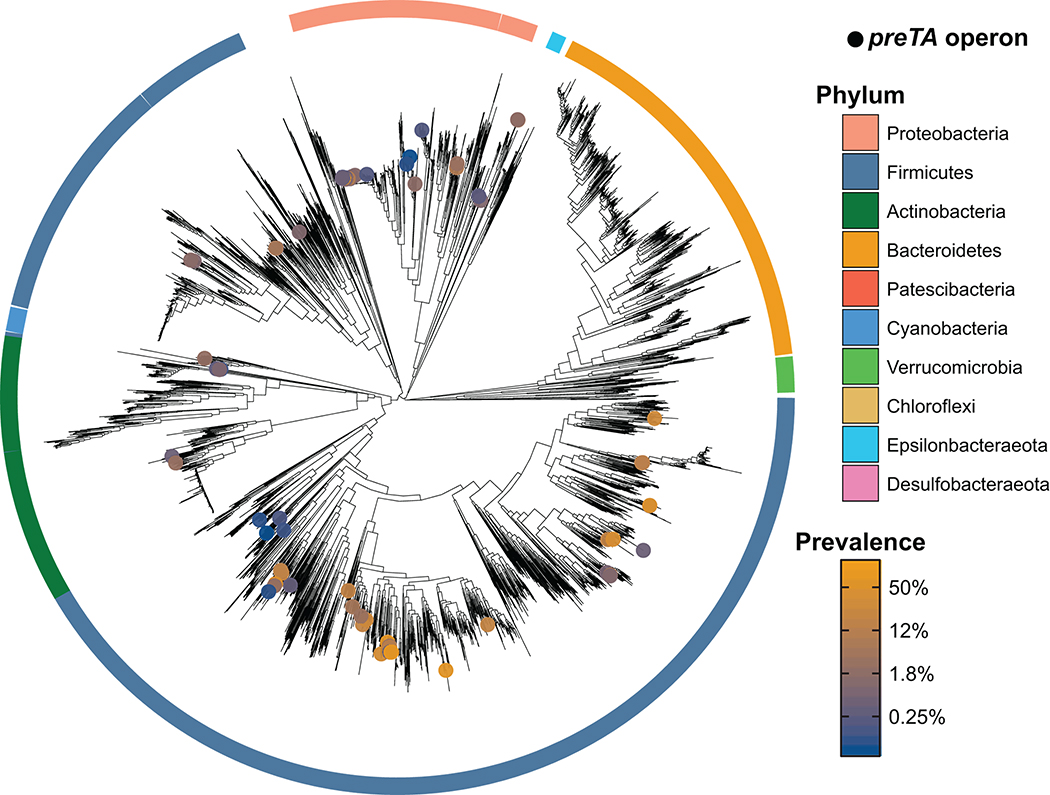
Extended Data Fig. 7. Distribution of preTA operons across gut metagenome-assembled genomes (MAGs).
A phylogenetic tree of species from IGGdb, made using a concatenated alignment of single-copy marker genes, is shown in black. Species in which a MAG contains a putative preTA operon are identified with colored circles, where the color of the circle corresponds to prevalence in the gut (blue: low prevalence; orange: high prevalence). All species displayed were detected at least once from 3,810 gut metagenome samples. Phylum-level annotations are shown as colored ring segments surrounding the tree for the ten phyla with the most gut MAGs. Data can be found in Supplementary Table 9.

