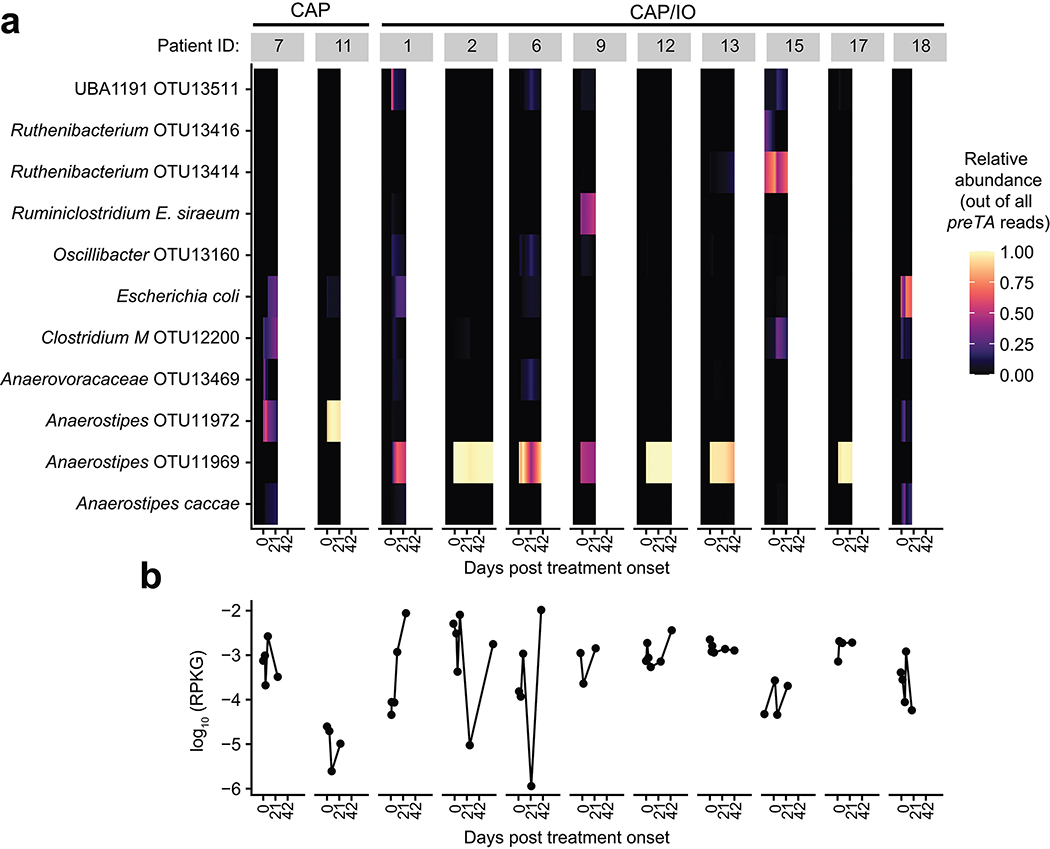
Extended Data Fig. 9. preTA sources and abundance in CRC patients during fluoropyrimidine treatment.
(a) Fraction of total preTA reads mapping to different species in metagenomic samples from GO Study patients undergoing CAP treatment with or without pembrolizumab immunotherapy (IO). Heatmap values were linearly interpolated between samples (filled circles in panel b). (b) Total abundance, as log10 RPKG, of the preTA operon in the gut microbiome prior to and during treatment with the oral fluoropyrimidine CAP with or without IO, as shown in Fig. 6d. Lines connect measurements (filled circles) for the same patient. One zero RPKG value was replaced with half the minimum non-zero value prior to taking the logarithm. The first day of treatment is defined as day 1. Days are the same between panels.

