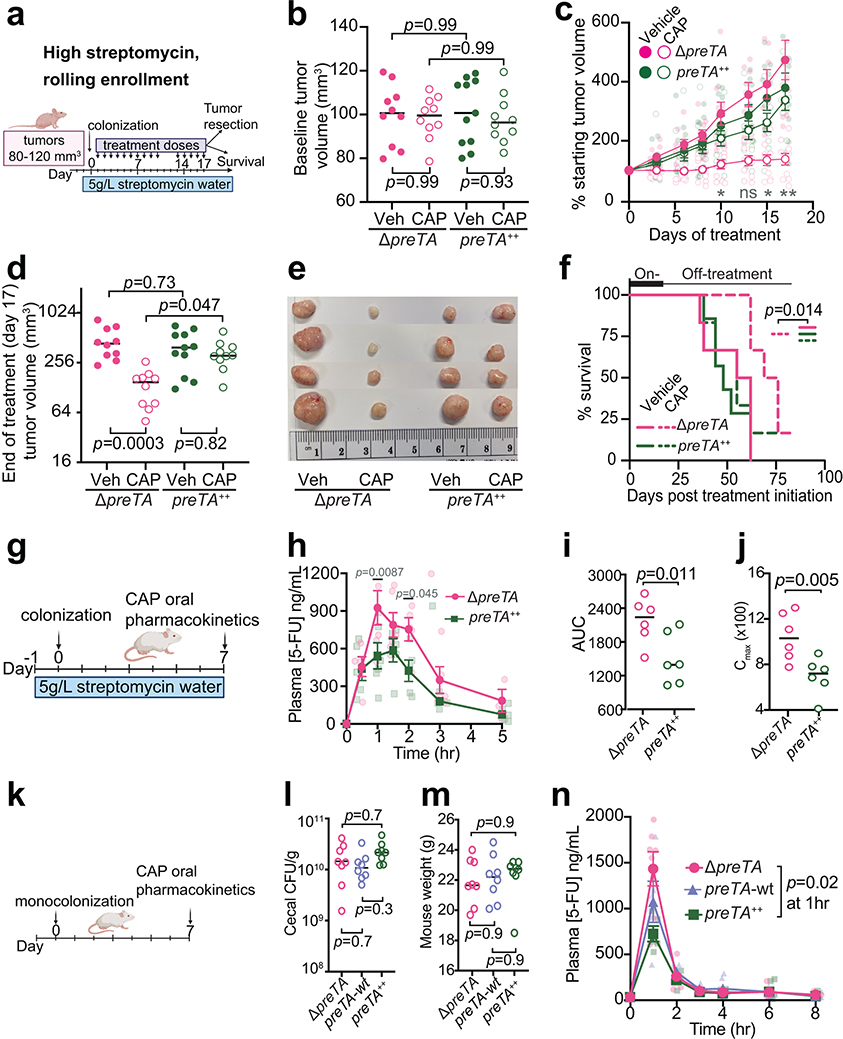
Fig. 4|. PreTA interferes with capecitabine (CAP) efficacy in mice.
(a) Schematic of xenograft mice colonized with ΔpreTA or preTA++ E. coli and treated with capecitabine (CAP) or vehicle (Veh). (b, d) Tumor volumes (b) pre- and (d) post-treatment (n=11 mice preTA++-Veh group; n=10 mice/group remainder; lines represent medians; 2-way ANOVA with Tukey’s correction). (c) Percentage of starting tumor volumes across time (n=11 mice preTA++-Veh; n=10 mice/group remainder; opaque dots and lines represent mean±SEM; 2-way ANOVA with Tukey’s correction; adjusted p-values=0.046 day 10, 0.053 day 13, 0.018 day 15, and 0.0012 day 17 for ΔpreTA-CAP vs. preTA++-CAP comparison). (e) Resected tumors post-treatment on day 17 (n=4 mice/group). (f) Percentage of mice reaching the humane endpoint (n=7 mice preTA++-Veh; n=6 mice/group remainder; log-rank Mantel-Cox test comparing ΔpreTA-CAP to all other groups). Two mice were censored as they did not reach the endpoint when the experiment ended on day 83. (g) Pharmacokinetics schematic in CONV-R mice colonized with ΔpreTA or preTA++ E. coli and administered with 1100 mg/kg CAP. (h) LC-MS/MS quantification of plasma 5-FU (n=6 mice/group; opaque dots and lines represent mean±SEM; mixed-effects analysis with Sidak’s correction). (i, j) Pharmacokinetics parameters such as (i) area under curve (AUC) and (j) peak plasma concentrations (Cmax) for plasma 5-FU (n=6 mice/group; lines are medians; Welch’s one-tailed t test). (k) Pharmacokinetics schematic in gnotobiotic mice mono-colonized with ΔpreTA, preTA++, or wild-type E. coli followed by oral administration of 500 mg/kg CAP. (l, m) Potential confounders like (l) colonization levels assessed by colony-forming units (CFU) per gram stool and (m) mouse weight were measured (n=8 mice/group; lines are medians; one-way ANOVA with Tukey’s correction). (n) LC-MS/MS quantification of plasma 5-FU (n=8 mice/group; opaque dots and lines represent mean±SEM; mixed-effects analysis with Tukey’s correction).

