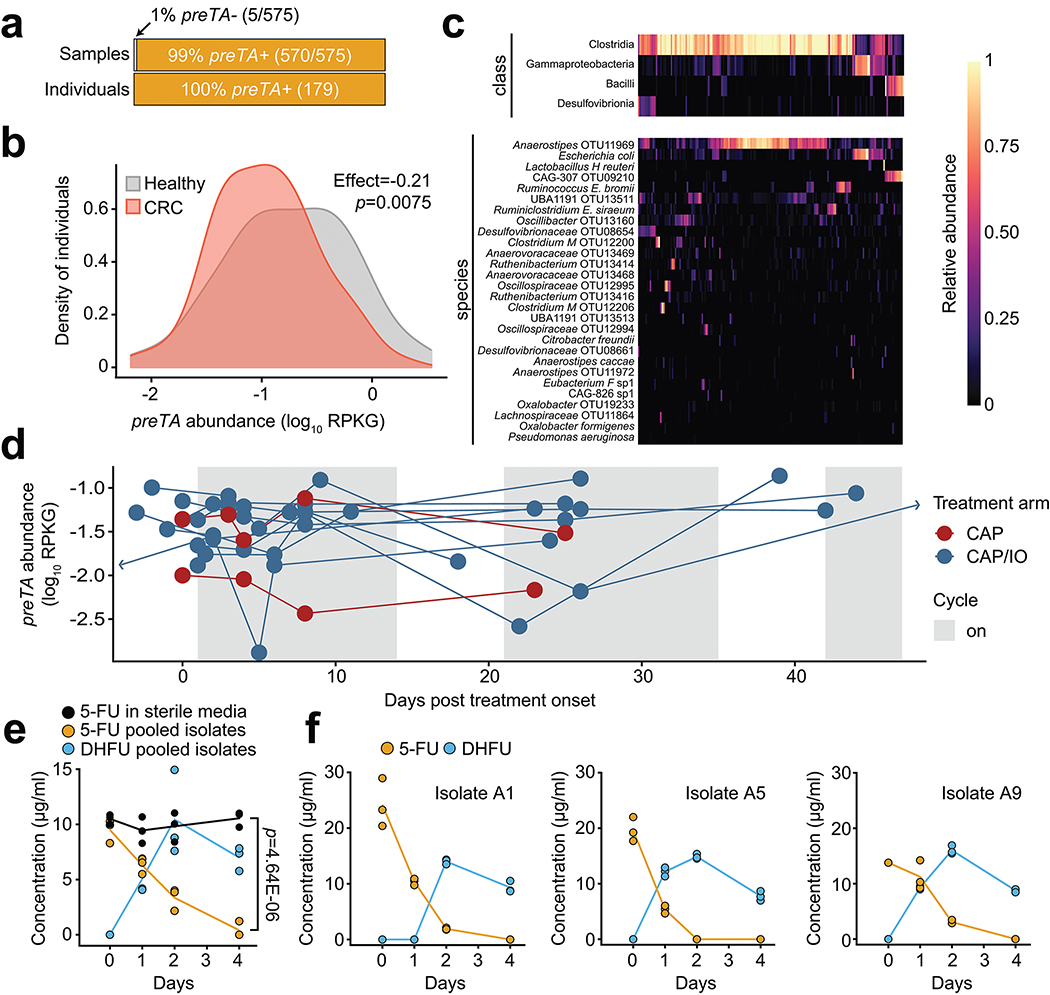
Fig. 6|. The preTA operon is prevalent and functional in the gut microbiomes of colorectal cancer (CRC) patients and controls, exhibiting marked inter-individual and temporal variation in abundance.
(a) Number of samples and individuals where preTA was detected (orange) or not detected (light gray). (b) Variation in preTA abundance, as log10 reads per kilobase of genome equivalents (RPKG), across CRC patients and healthy controls where preTA was detected (n=179 individuals59). (c) Fraction of total reads mapping to preTA in CRC and control samples where it was detected (x-axis) whose best hit was in a given phylogenetic class (top) or species (bottom). Taxa are ordered by decreasing mean across all samples; samples are ordered based on hierarchical clustering using Bray-Curtis dissimilarity and complete linkage. (d) Abundance, as log10 RPKG, of the preTA operon in the gut microbiome prior to and during treatment with the oral fluoropyrimidine CAP (red) or a combination of CAP and immunotherapy (blue). Lines connect measurements for the same patient. One zero RPKG value was replaced with half the minimum non-zero value prior to taking the logarithm. 3/11 patients varied over an order of magnitude during treatment (Extended Data Fig. 9). The first day of treatment is defined as day 1. Two samples collected on days −16 and 66 were censored for display purposes. (e) Bacterial isolates from a representative CRC patient stool sample in the GO Study (patient 1, Supplementary Table 12) were isolated on McConkey agar, pooled, and incubated in BHI+ with 5-FU for 4 days and 5-FU/DHFU were quantified by LC-QTOF/MS. p-value, two-way ANOVA contrasting 5-FU levels in sterile and inoculated media. (f) Three bacterial isolates from the same CRC patient stool sample were incubated as described in panel e (n=3 biological replicates). Lines in e,f represent means.

