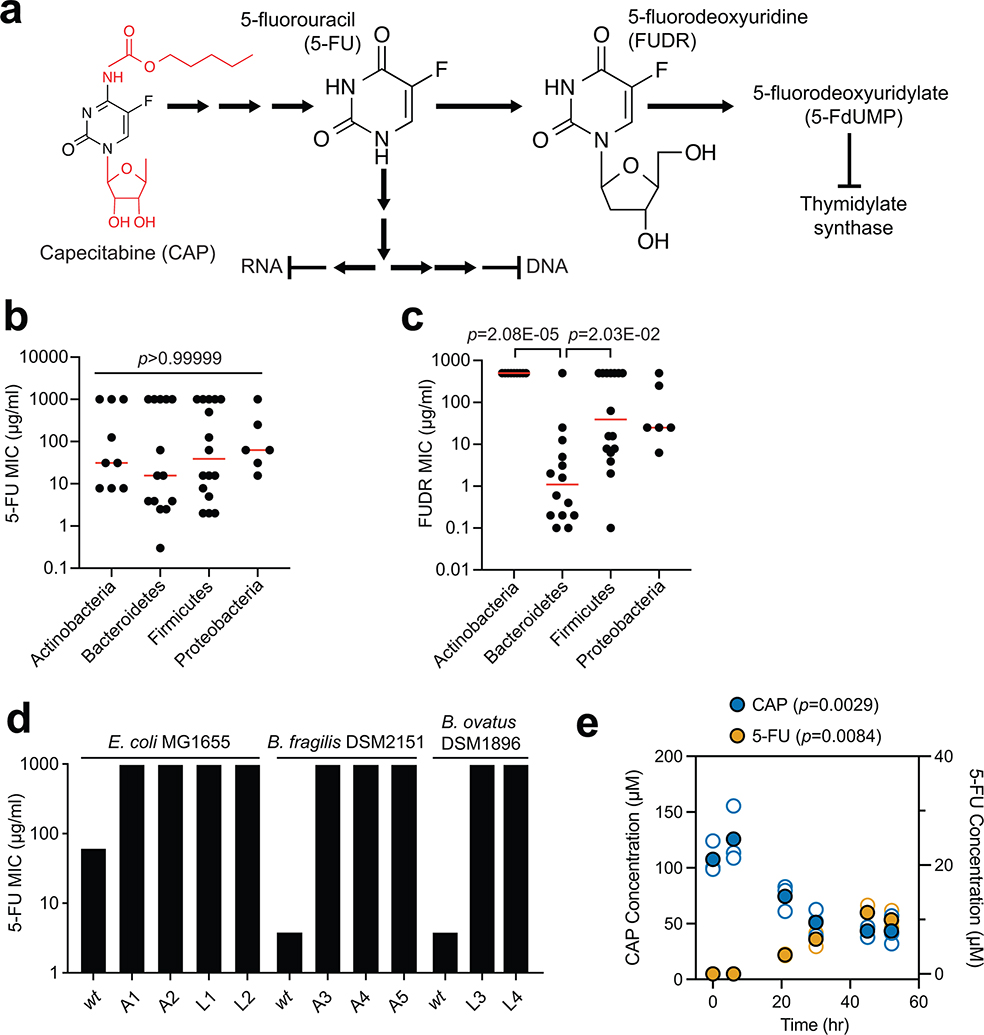
Extended Data Fig. 1. Bacterial taxa vary in their sensitivity to fluoropyrimidines despite the rapid emergence of resistance during in vitro growth.
(a) Simplified metabolic pathway for the bioactivation of the oral prodrug capecitabine (CAP) to 5-fluorouracil (5-FU), 5-fluorodeoxyuridine (FUDR), and downstream metabolites82. Red indicates chemical groups hydrolyzed during the conversion of CAP to 5-FU. Sequential reactions are indicated by multiple arrows. (b,c) Variation in (b) 5-FU and (c) FUDR minimal inhibitory concentration (MIC) at the phylum level. Bacterial strains where no MIC could be determined were set to the maximum tested concentration. Each dot represents a bacterial isolate. Red lines indicate the median. p-values, Kruskal-Wallis test with Dunn’s correction for multiple comparisons. (d) 5-FU MICs of parent and 5-FU-resistant strains of E. coli MG1655, B. fragilis DSM2151, and B. ovatus DSM1896 (see Supplementary Table 2). The type of selection is indicated by the strain identifier: A=agar; L=liquid. (e) Wild-type E. coli BW25113 was assayed for conversion of CAP to 5-FU by LC-MS/MS (n=3 biological replicates per group). Open circles represent individual values, filled circles represent mean values. p-values, two-tailed paired t test comparing final vs. baseline values for each analyte.

