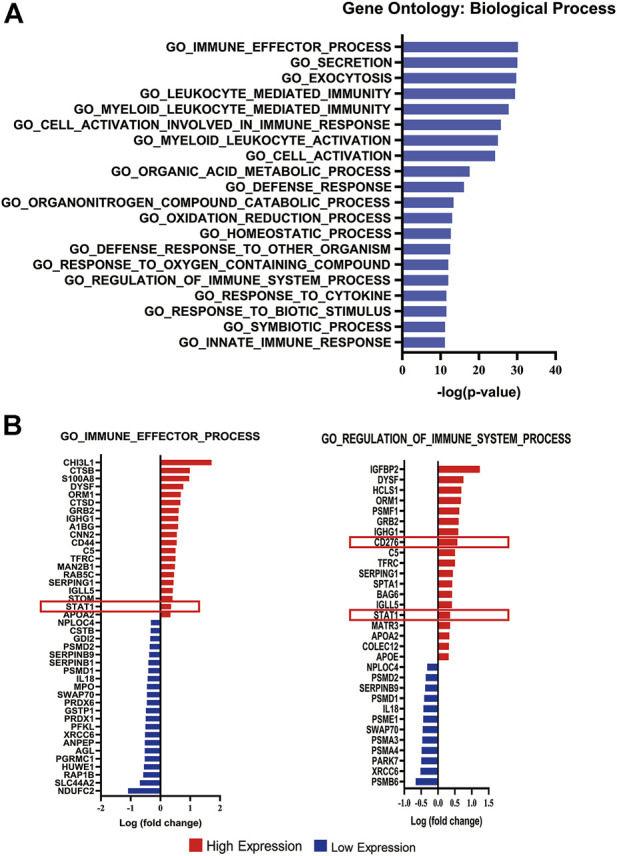
FIGURE 2.

Enrichment analysis of differentially expressed proteins. (A) Bar chart displaying the top 20 significant pathways according to the enrichment analysis. (B) Diagram listing the proteins involved in the GO_IMMUNE_EFFECTOR_PROCESS and GO REGULATION OF IMMUNE SYSTEM PROCESS pathways.The X-axis represents the log(fold change). Red bars represent upregulated expression, and blue bars represent downregulated expression in malignant meningiomas. The red box displays the upregulated expression of STAT1 and B7-H3 in malignant meningiomas.
