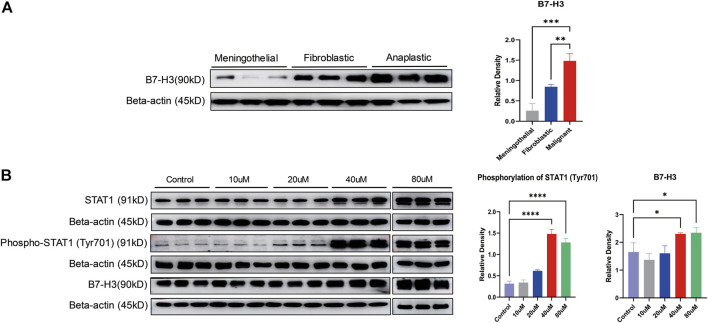
FIGURE 3.
Validation of the expression of B7-H3 and STAT1 in meningiomas. (A) The expression of B7-H3 is displayed in different subtypes of meningiomas. The bar chart shows the relative density of B7-H3. The X axis marks the subtypes, and the Y axis represents the relative density; **p < 0.01, ***p < 0.001. (B) The expression of STAT1, phospho-STAT1 (Tyr701) and B7-H3 is displayed at different concentrations of LB-100 (10, 20, 40, and 80 uM). Two bar charts show the phosphorylation of STAT1 (Tyr701) and the relative density of B7-H3. The X axis marks different concentrations of LB-100, and the Y axis represents the relative density; *p < 0.05, ****p < 0.0001.

