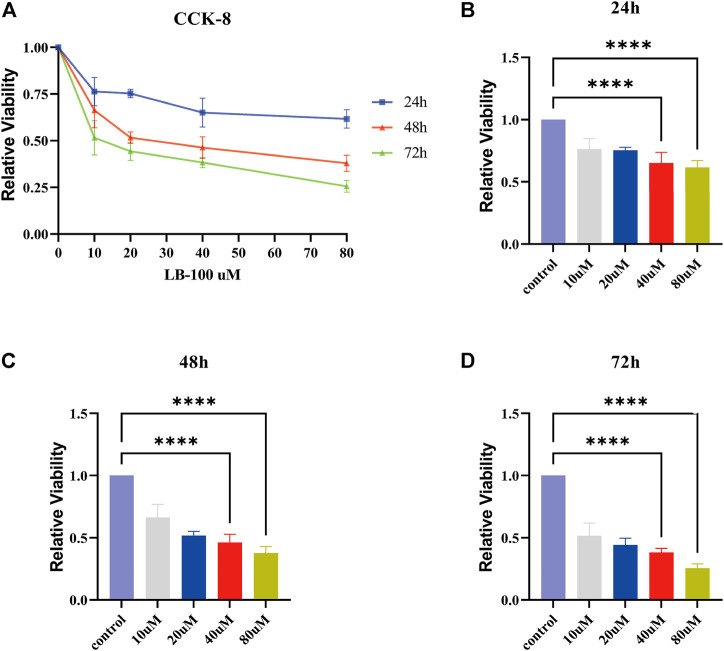
FIGURE 4.
Effect of LB-100 on the proliferation of meningiomas. (A) The line chart displays the relative viability of IOMM-Lee cells treated with LB-100 at concentrations of 0 uM (control), 10, 20, 40, and 80 uM for 24, 48, and 72 h. The X axis represents the concentration of LB-100, and the Y axis represents relative viability. (B–D) The bar chart displays the relative viability for 24, 48, and 72 h at different concentrations of LB-100. The X-axis represents the concentration of LB-100, and the Y-axis represents relative viability; **p < 0.01, ****p < 0.0001.

