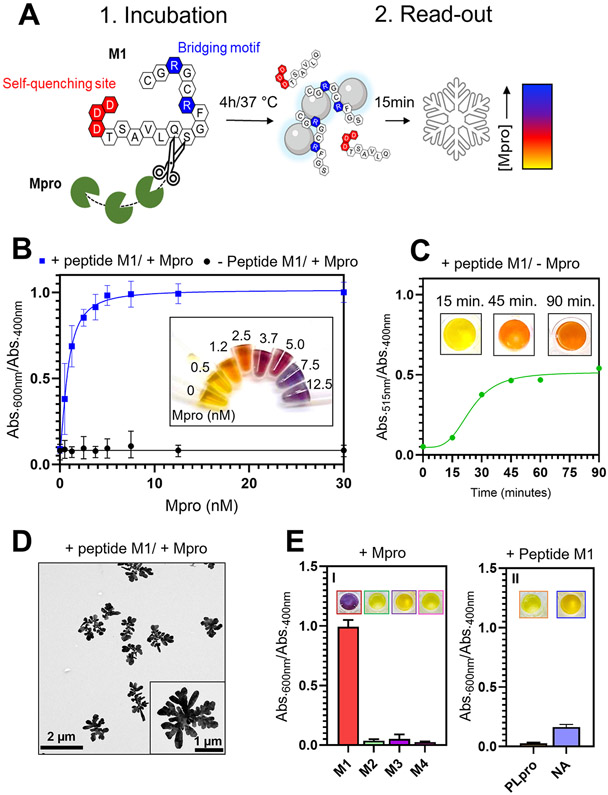
Figure 4.
Detection of the enzymatic activity of Mpro. (A) Illustration of the sensing mechanism with (1) the incubation of the peptide M1 and Mpro that after 4 h leads to the cleavage of M1 and (2) the read-out of Mpro activity with the AgNPs-BSPP that assemble due to the release of a “bridging fragment”. The optical responses are proportional to the concentration of Mpro. (B) Optical response (Abs.600 nm/Abs.400 nm) obtained 15 min after the addition of AgNPs-BSPP to Mpro samples that were incubated 4 h either with 5 μM M1 (blue) or in the absence of M1 (black). Inset shows the corresponding pictures. (C) Optical response (Abs.515 nm/Abs.400 nm) of the AgNPs-BSPP mixed with M1 in the absence of Mpro over time. Insets show pictures of the sample at 15, 45, and 90 min. (D) TEM images showing the reshaping of the AgNPs-BSPP when mixed with 12.5 nM Mpro incubated with M1. (E) Optical response at 15 min obtained for the detection of (I) Mpro incubated with either M1, M2, M3, or M4 or (II) PLpro and NA incubated with M1. Insets show the corresponding pictures.

