Figure 5.
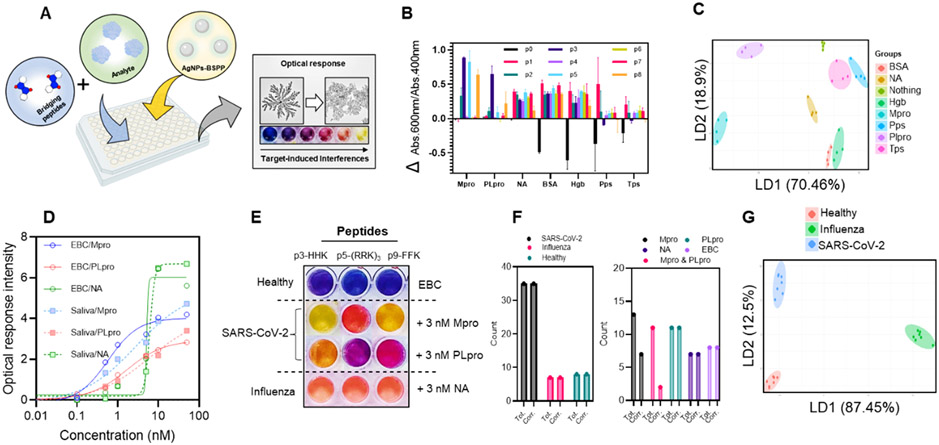
Sensor-array mechanism and mode of response. (A) Illustration of the sensor-array with the optical response that is proportional to the interference caused by the analyte in the peptide–particles interaction. (B) Optical response pattern obtained for different proteins and eight peptides. Four replicates were performed for each protein. (C) Canonical score plot for the first two factors of the simplified optical response pattern of the sensor-array obtained by LDA against 10 nM of different proteins in water. Ellipses are 75% confidence. (D) Optical response intensity as a function of the concentration of proteins spiked in EBC or saliva. (E) Simplified picture of the sensor-array against healthy EBC spiked or not with 3 nM Mpro, PLpro, or NA. (F) Blind study results showing the total number of the different samples and the correctly identified samples. Tot. = total and Corr. = correct. (G) Canonical score plot for the first two factors of the simplified optical response pattern from the sensor-array obtained by the LDA against 3 nM Mpro and PLpro or NA spiked in healthy EBC. Ellipses are 99% of confidence.

