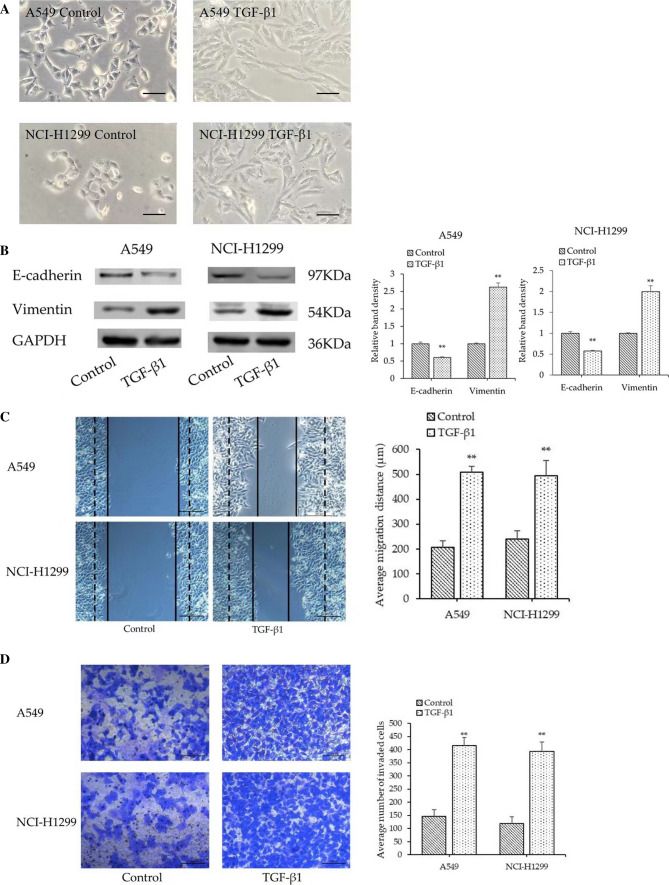
Fig. 3.
TGF-β1 regulates morphology migration, invasion and EMT of A549 and NCI-H1299 cells. A Micrographs of A549 and NCI-H1299 cell morphology after their culture in 10 ng/ml TGF-β1 for 48 h (Magnification, × 100). B The expression of E-cadherin and vimentin was evaluated by Western Blot analysis. C Wound healing assay (Magnification, × 100) and D Transwell assay (Magnification, × 200) were performed to assess the cell migration and invasion abilities. ** P < 0.01 compared to control group. Data were expressed as mean ± standard deviation. One-way ANOVA were used to assess differences between groups. The SPSS 25.0 software (USA) used for creation of the figure

