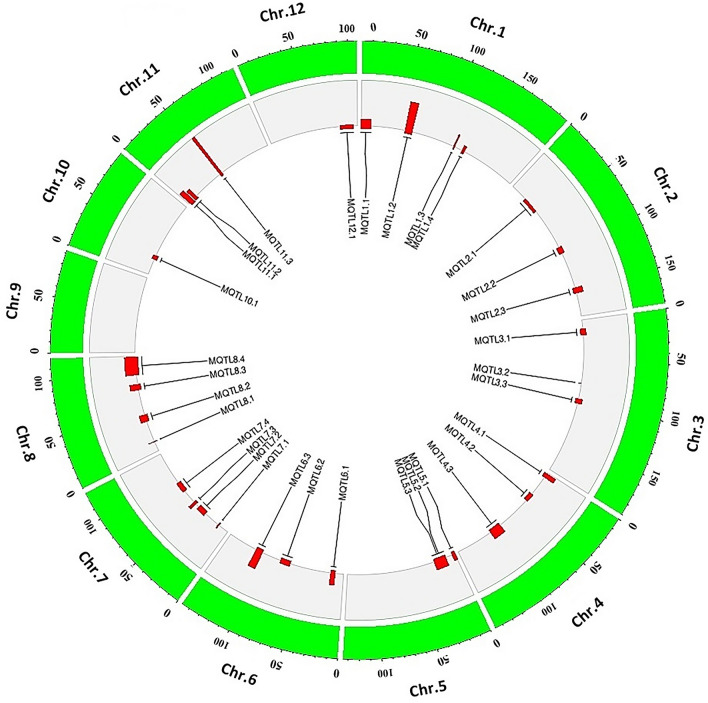
Fig. 5.
A circular plot represents the overall MQTL information, where the inner layer indicates the names and positions of MQTLs on the chromosomes. The width and height of the bars horizontally and vertically present CI and mean phenotypic variance (PVE) on each of the 12 rice chromosomes, respectively

