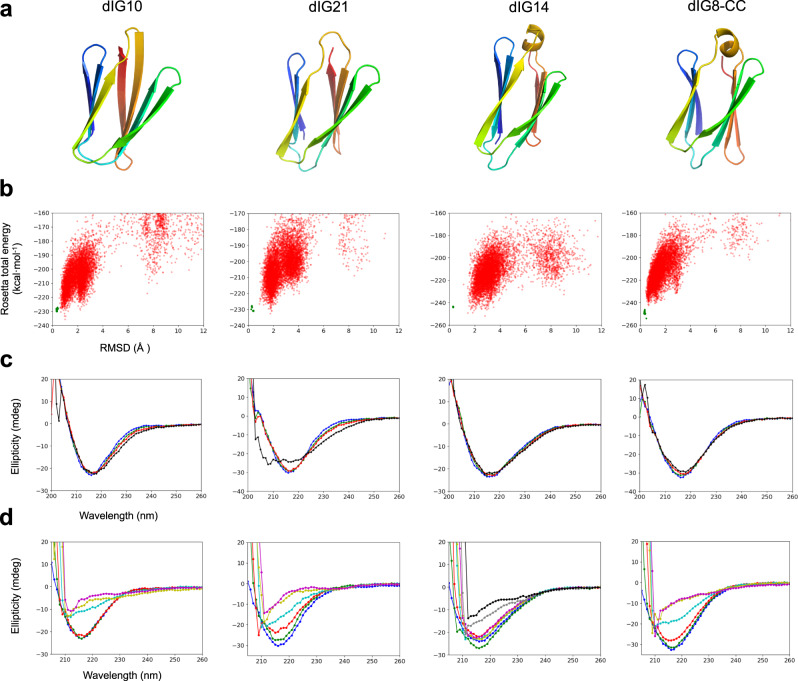
Fig. 3. Folding and stability of designed proteins.
a Examples of design models. b Simulated folding energy landscapes, with each dot representing the lowest energy structure obtained from ab initio folding trajectories starting from an extended chain (red dots) or local relaxation of the designed structure (green dots). The x-axis depicts the Cα-RMSD from the designed model and the y-axis, the Rosetta all-atom energy. c Far-ultraviolet circular dichroism spectra (blue: 25 °C; green: 55 °C; red: 75 °C; black: 95 °C). d Far-ultraviolet circular dichroism spectra at different guanidine hydrochloride concentrations and at 25 °C (blue: 0 M; green: 1 M; red: 2 M; cyan: 3 M; yellow: 4 M; magenta: 5 M; gray: 6 M; black: 7 M).

