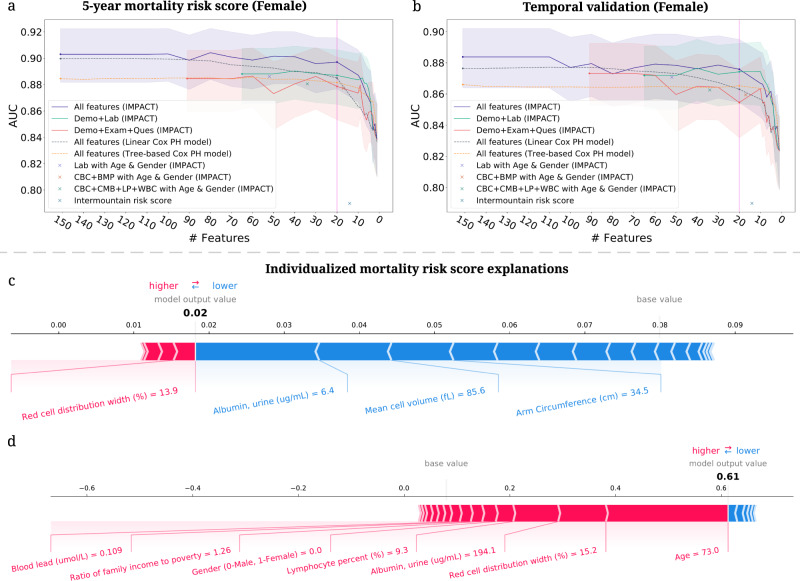
Fig. 8. Developing highly accurate and efficient interpretable 5-year mortality risk scores.
a, b The AUROC of the models using different feature sets after recursive feature elimination. Lines are mean performance over 1000 random train/test splits, and shaded bands are 95 percent normal confidence intervals. a The AUROC of the models tested on the female group in the test set of NHANES 1999–2008. b The AUROC of the models tested on the female group in the temporal validation set (NHANES 2009–2014). c, d IMPACT can analyze individualized mortality risk scores. c The individualized explanation for an individual who is alive after 5 years. The output value is the risk score for that individual. The base value is the mean risk score, i.e., the score that would be predicted if we did not know any features for the current output. The features in red increase mortality risk, and those in blue decrease it. d The individualized explanation for a sample who is deceased after 5 years.

