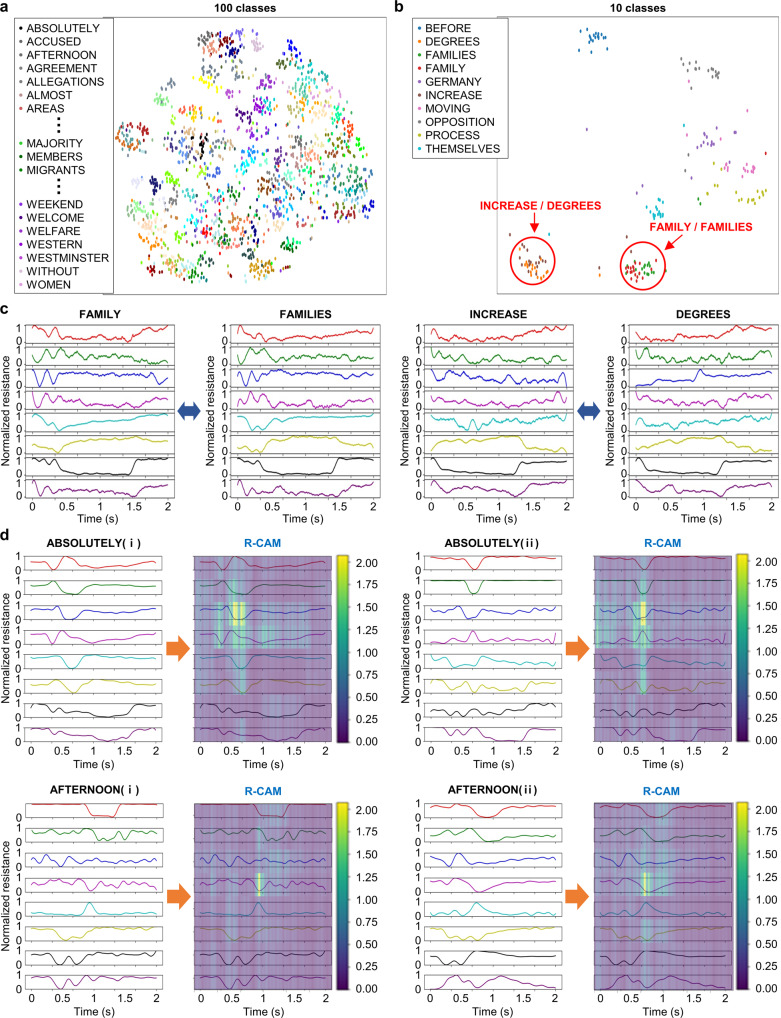
Fig. 4. Analysis and verification of results.
a T-distributed stochastic neighbor embedding (t-SNE) of 100 words, visualizing the result of validation 1 in Fig. 3b. All 100 words are allocated in points of different colors. The denser the cluster of same-colored points is plotted, the more the model classifies them as similar data. b t-SNE of the most confused 10 words out of 100 words. c Two pairs of normalized waveforms of words exhibiting similar facial movement during pronunciation (FAMILY/FAMILIES and INCREASE/DEGREES). d Relevance-CAM (R-CAM) that explains our model by highlighting which region of the entire waveform is dominant to classify each word, demonstrating that the model focuses on characteristic signal parts where the variance of the resistance is large.

