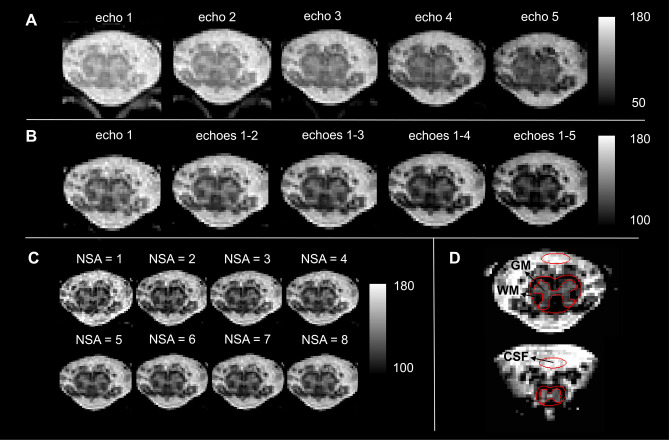
Figure 2.
Visual representation of echoes, echo combinations, signal averages, and image segmentations. The 3D spoiled multi-echo gradient echo sequence (Siemens FLASH) consisted of 5 echoes and was acquired with 8 individual repetitions. For each subject, a series of images was created by successively combining echoes (echo 1, 1–2, 1–3, 1–4, 1–5) and averaging across repetitions (number of signal averages (NSA): 1, 2, 3, …, 8), resulting in a total of 72 images. (A) Image series of individual echoes (NSA = 8) for a representative slice in the lumbosacral enlargement (LSE). (B) Image series of increasing number of combined echoes in the same slice as in (A) (NSA = 8). (C) Image series with increasing NSA (3 combined echoes). (D) Spinal cord (SC) and gray matter (GM) were segmented manually in each slice (here a representative LSE and conus medullaris slice are shown). A mask of cerebrospinal fluid (CSF) was drawn anterior to the SC. White matter (WM) mask was obtained by subtracting GM from the SC mask.

