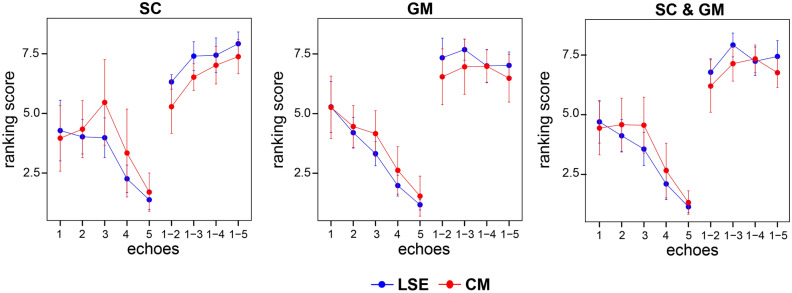
Figure 5.
Qualitative comparison of the individual and combined echoes (8 signal averages). Shown are ranking scores assigned to individual echoes (1, 2, 3, 4, 5) and combined echoes (1–2, 1–3, 1–4, 1–5) and averaged across all participants (n = 10) and raters (n = 5). Echoes/echo combinations were ranked separately for spinal cord (SC) only, gray matter (GM) only and joint SC and GM segmentability. The analysis was performed in a representative slice at the lumbosacral enlargement (LSE) in blue and conus medullaris (CM) in red. Ranking score ranges from 1 (lowest score) to 9 (highest score). Error bars represent standard deviation across participants.

