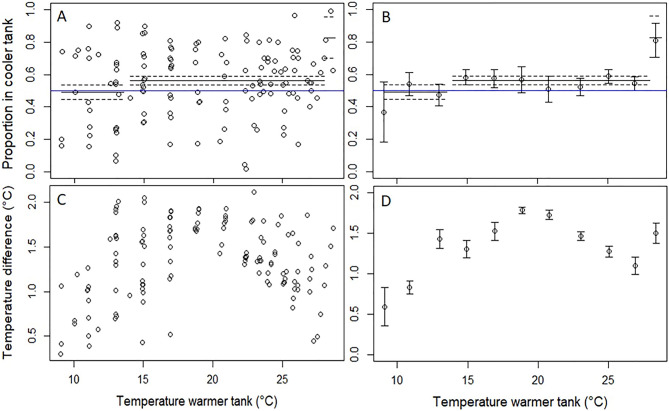
Figure 2.
Panel (A) shows the proportion of sub-adult Delta Smelt in the cooler tank versus water temperature in the warmer tank. The solid black line represents the top-ranked model and the dashed lines are the 95% CI. Panel (B) shows the same as panel (A), but with means ± SE for temperature bins rather than raw data. Panel (C) shows the difference in water temperature between the higher and lower temperature tank by temperature in the warmer tank. Panel (D) shows the same as panel (C) but with means calculated for temperature bins. The mean temperature difference between the warmer and cooler tanks was 1.3 °C (SD = 0.5 °C). Note that the blue, horizontal line indicates no preference (i.e., a y-intercept of 0.5).

