Figure 2.
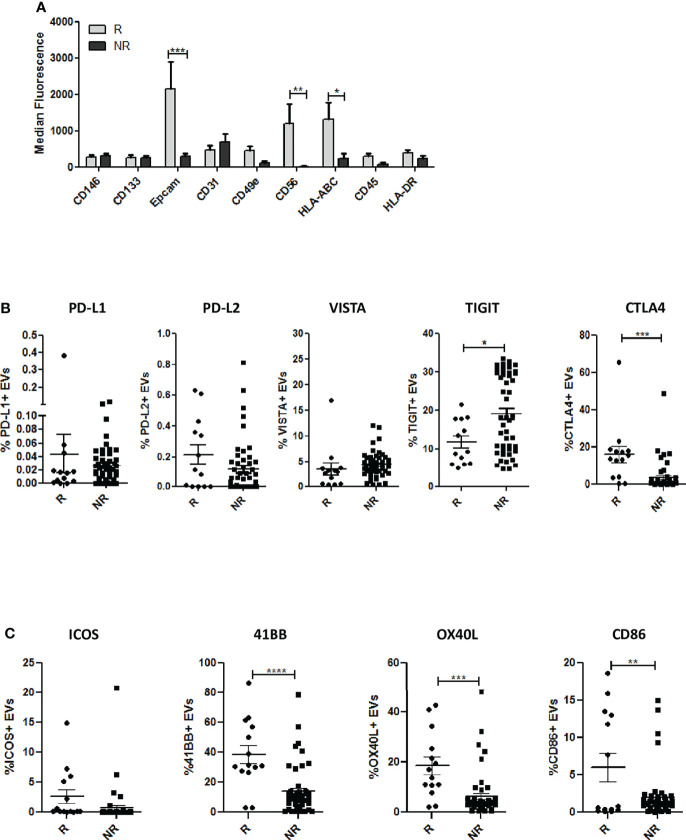
Phenotypic analysis of EVs. (A) Profiles of surface markers determined by MACSPlex Exosome Kit in EVs from R and NR patients. The values are the median fluorescence intensities (R n = 8; NR n = 10). (B) Surface expression of inhibitory molecules PD-L1, PD-L2, VISTA,TIGIT and CTLA4 on EVs from R (n = 13) and NR patients (n = 51), evaluated by flow cytometry. (C) Surface expression of co-stimulatory molecules (CD86, 41BB, ICOS and OX40L) in EVs from R (n = 13) and NR patients (n = 51), measured by flow cytometry. The data are expressed as the mean ± S.E.M. values. (*p < 0.05; **0.05 < p < 0.001; ***0.001 < p < 0.0001; ****p < 0.0001).

