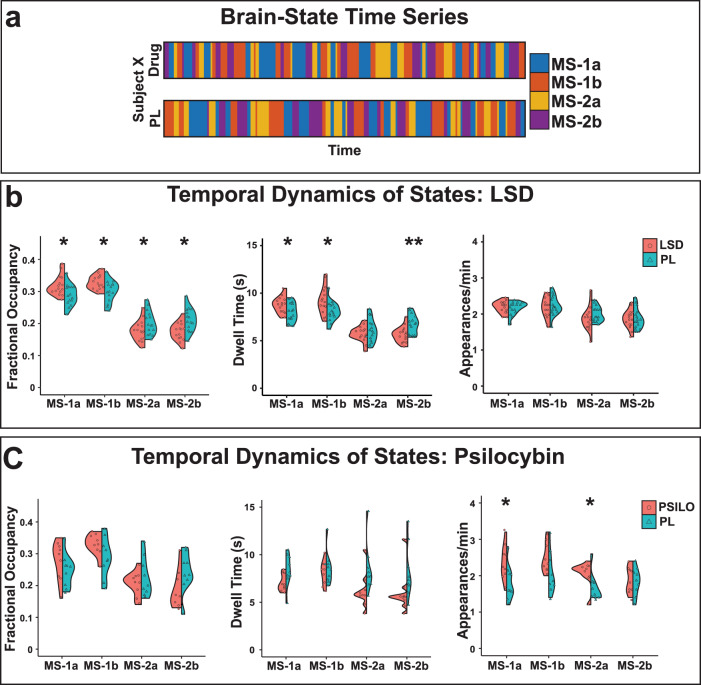
Fig. 3. Temporal brain dynamics shift under psychedelics.
a k-means clustering of the BOLD time series resulted in a brain state time series for each of the individuals’ two scans29. We then calculated each brain states’ (left) fractional occupancy, (center) average dwell time, and (right) average number of appearances per minute for each individual and condition in the b LSD and c psilocybin datasets. Comparisons were made using two-sided t-tests and p-values were corrected for multiple comparisons (Benjamini-Hochberg) where indicated. *uncorrected p < 0.05, **corrected p < 0.05. Source data are provided as a Source Data file.

