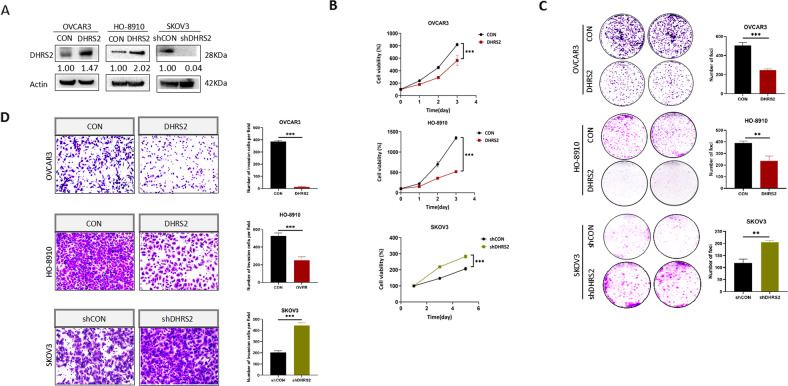
Fig. 1. DHRS2 Inhibits the growth and invasion in ovarian cancer cells.
A DHRS2 protein expression levels of in OVCAR3-CON, OVCAR3-DHRS2, HO-8910-CON, HO-8910-DHRS2, SKOV3-shCON, and SKOV3-shDHRS2 cells. B Cell viability of the designated groups was detected by MTS assay. C Foci formation ability of the designated groups was determined by colony formation assay. D Cells were seeded in the upper chamber with Matrigel coating for 72 h, and cell invasion ability of the designated group was determined. Data are shown as mean values ± S.D. of independent, triplicate experiments. The asterisks (*,**,***) indicate significant differences (p < 0.05, p < 0.01, p < 0.001, respectively).

