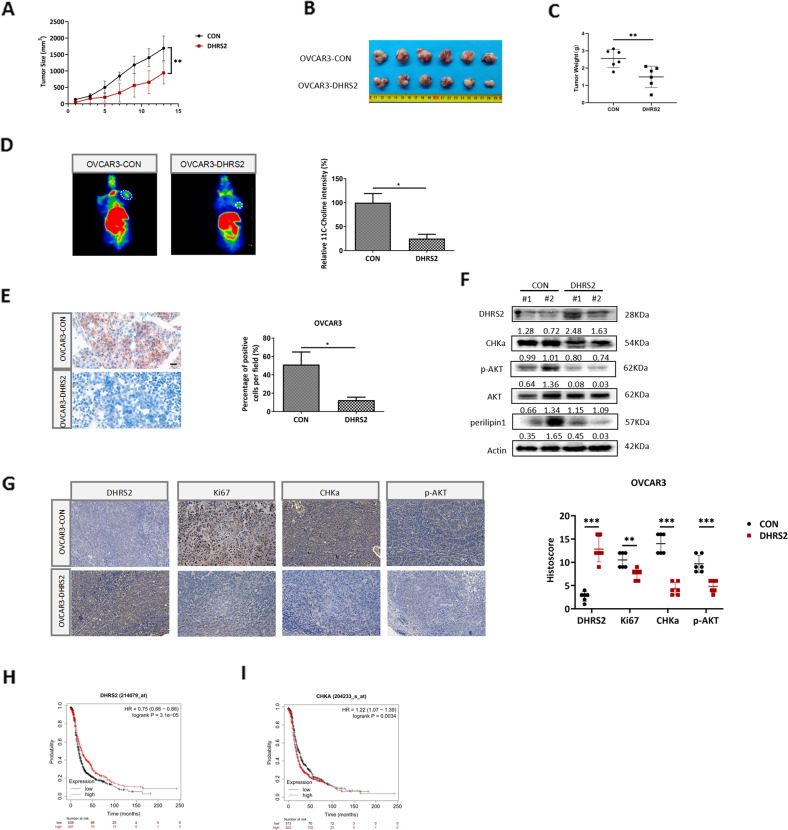
Fig. 5. DHRS2 impairs tumor growth in vivo by interfering with the CHKα-AKT axis and choline metabolism.
A The growth curve of OVCAR3-CON and OVCAR3-DHRS2 cells in vivo. Female BALB/c nu/nu mice were subcutaneously inoculated with OVCAR3-CON and OVCAR3-DHRS2 cells (n = 6 per group). Tumor volume was examined every other day and shown in the graph. B At the end of the experiment, the mice were sacrificed and the tumors were separated. C Tumor mass of each group was measured and shown in the graph. D 11C-Choline micro-PET/CT was performed and standardized uptake value (SUV) intensity was observed in the designated groups. E Representative images of Oil Red O staining in tumor tissues of the designated group. F The protein levels of DHRS2, CHKα, p-AKT, AKT, and perilipin1 in tumor tissues of the designated group. G Representative images of tumor sections in each group stained with indicated antibodies. Antibody staining is in brown and nuclear counter staining is in blue. Scatter diagram shows Histoscore for the indicated antibody staining in tumor samples. Survival analysis from TCGA dataset assessed by the Kaplan–Meier method for OC patients with high or low signature of H DHRS2 and I CHKα genes. Data are shown as mean values ± S.D. of independent, triplicate experiments. The asterisks (*,**,***) indicate significant differences (p < 0.05, p < 0.01, p < 0.001, respectively).

