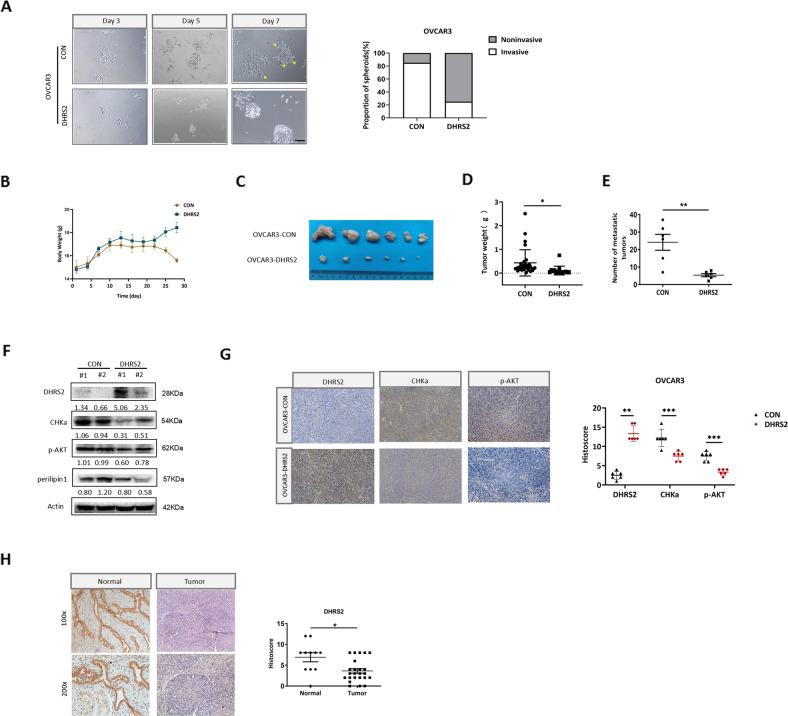
Fig. 6. DHRS2 hampers the invasion and metastasis of OC cells.
A Representative images of spheroids formed by OVCAR3 cells in Matrigel (left). The invasive spheroids were featured by scattered protrusions formed on the spheroid surface, as indicated by yellow arrows. Scale bar, 50 μm. Proportion of two spheroid types in OVCAR3-CON and OVCAR3-DHRS2 cells (right) (p < 0.05). Stable OVCAR3-CON and OVCAR3-DHRS2 cells were injected into the abdominal cavity, respectively (n = 6 per group). B During the experiment, the body weight of the mice was determined every 3 days and shown in the graph. C Representative intraperitoneal metastatic tumors in the designated group. D, E The amount and mass of the metastatic tumors were shown in the graph. F The protein levels of DHRS2, CHKα, p-AKT, and perilipin1 in tumor tissues of the designated group. G Representative images of tumor sections in each group stained with indicated antibodies. H The representative images of DHRS2 staining in OC tissues and non-tumor tissues. The scatter diagram shows Histoscore for DHRS2 staining in the designated samples. Data are shown as mean values ± S.D. of independent, triplicate experiments. The asterisks (*,**,***) indicate significant differences (p < 0.05, p < 0.01, p < 0.001, respectively).

