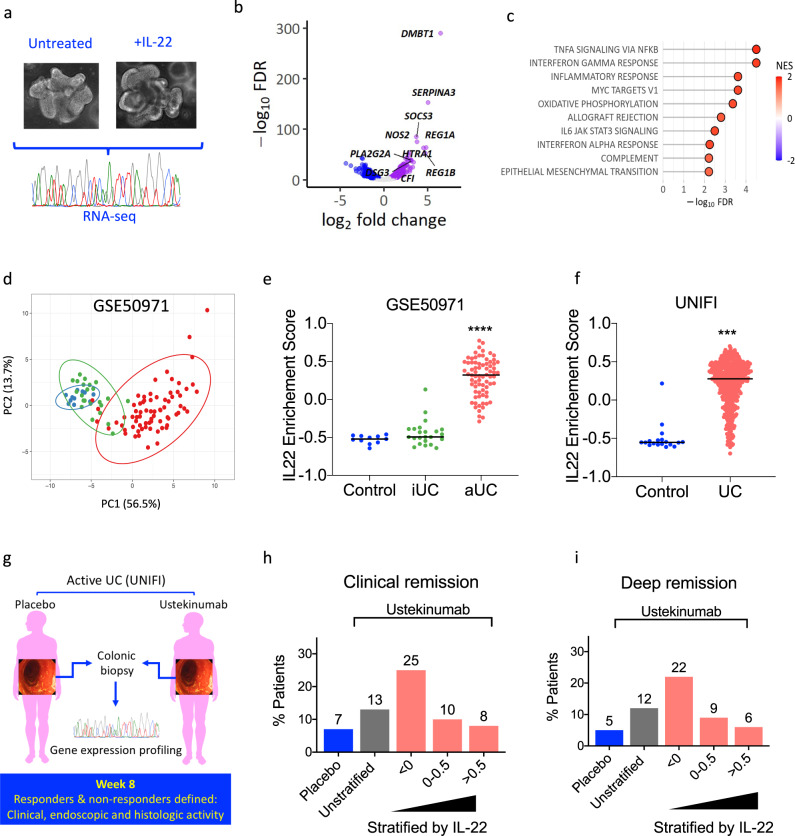
Fig. 1. Clinical significance of the IL-22 responsive transcriptional network in ulcerative colitis.
a Experimental schema of IL-22 stimulation of colonic organoids (n = 4 biological replicates, IL-22 concentration: 10 ng/ml, duration: 24 h). b Volcano plot demonstrating fold change and false discovery rate (FDR) of differentially expressed genes in human colonoids treated with recombinant IL-22. c Pathway analysis of DEG regulated by IL-22 (top 10, hallmark gene sets as defined in MSigDB, NES: normalized enrichment score). d Expression of the top 50 upregulated transcripts regulated by IL-22 in colonic mucosa separates healthy controls (blue, n = 11), patients with endoscopically inactive UC (green, n = 23) and active UC (red, n = 74) (principal component analysis, reposited dataset: GSE50971). e Enrichment of the IL-22 regulated transcriptional program (gene set variation analysis, gene set: top 50 upregulated genes) in the reposited dataset GSE50971 (healthy control: control, iUC-inactive UC, aUC-active UC, Kruskal–Wallis test, ****p < 0.0001). f Validation of the enrichment for the IL-22 regulated transcriptional program in biopsies taken from healthy controls (control, n = 18) and patients with UC (n = 550) participating in UNIFI trial (Mann–Whitney test, two-sided test, ***p < 0.001). g, h, i Association of the IL-22 enrichment score with clinical outcomes in UNIFI. Clinical remission (defined as a total Mayo score of ≤2 and no subscore >1) and deep remission [which required both clinical remission and mucosal healing defined as histologic improvement (neutrophil infiltration in <5% of crypts, no crypt destruction, and no erosions, ulcerations, or granulation tissue) and endoscopic improvement] at week 8 in UC patients enrolled in the UNIFI clinical trial program stratified according to IL-22 enrichment score in baseline biopsies sampled immediately prior to initiation of ustekinumab (n = 358) or placebo (n = 184). Blue bar shows response rate in placebo-treated UC patients. Gray bar shows response for all patients treated with ustekinumab. Red bars show response for all patients treated with ustekinumab stratified based on the extent of the IL-22 transcriptional program’s activation (ES). Patient numbers and statistical analysis shown in Supplementary Fig. 1. Source data for b, c, d, e, f, h and i are provided as a Source Data file.

