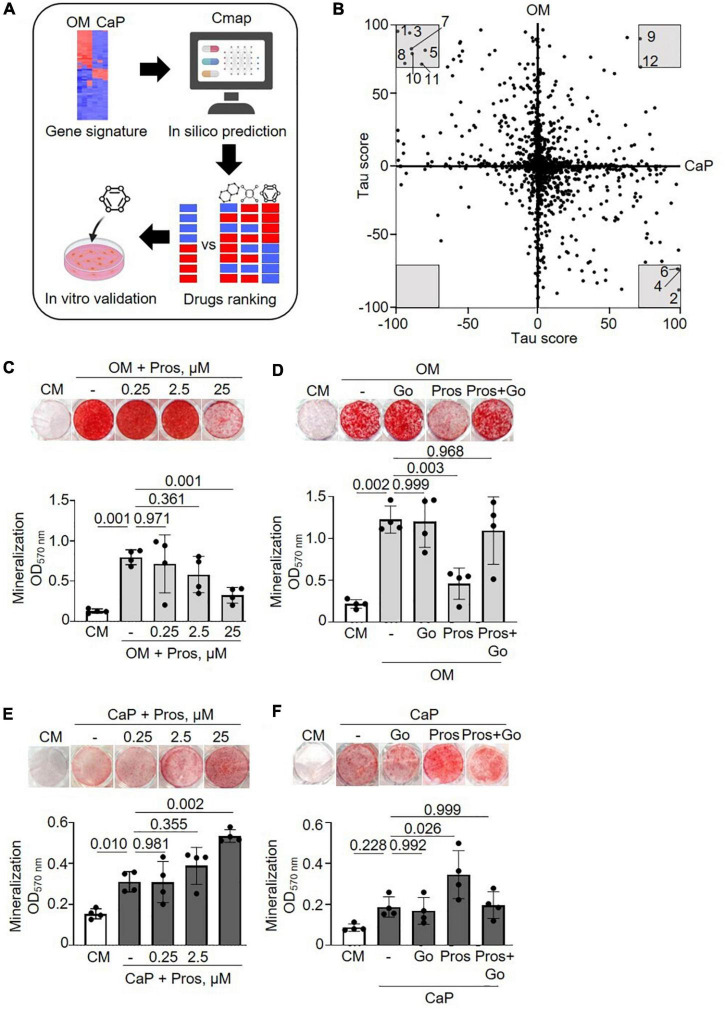
FIGURE 4.
Drug repurposing of osteogenic medium (OM) and calcium phosphate (CaP) gene signatures. (A) Scheme of the method. Created with https://Biorender.com (B) Scatter plot with predicted effects of drugs on OM and CaP-induced calcification. Gray area–drugs with predicted tau score < or > 70. 1: PD-184352, 2: Prostratin, 3: Fluticasone, 4: Ingenol, 5: L-690330, 6: Phorbol 12-myristate 13-acetate (PMA), 7: Halometasone, 8: Sunitinib, 9: MLN-2238, 10:Hydrocortisone, 11: Benzatropine, 12: Puromycin. (C,D) Effect of the protein kinase C (PKC) activator prostratin (Pros) and the PKC inhibitor Go6983 (Go) in OM and (E,F) in CaP-calcified immortalized vascular smooth muscle cells (iSMCs). iSMCs were cultured in control medium (CM) and OM for 14 days or CaP for 7 days with different concentrations of prostratin (0.25, 2.5, and 25 μM). Go (100 nM) was combined with 25 μM prostratin. Representative images of extracellular matrix mineralization (top) detected by alizarin red S staining and quantification of eluted staining (bottom). n = 4–5. C-H, DMSO (1:1,000) was used as solvent control in CM, OM, and CaP groups. Error bars indicate ± SD. Each n indicates an independent replicate. One-way ANOVA with Dunnett’s post hoc test.

