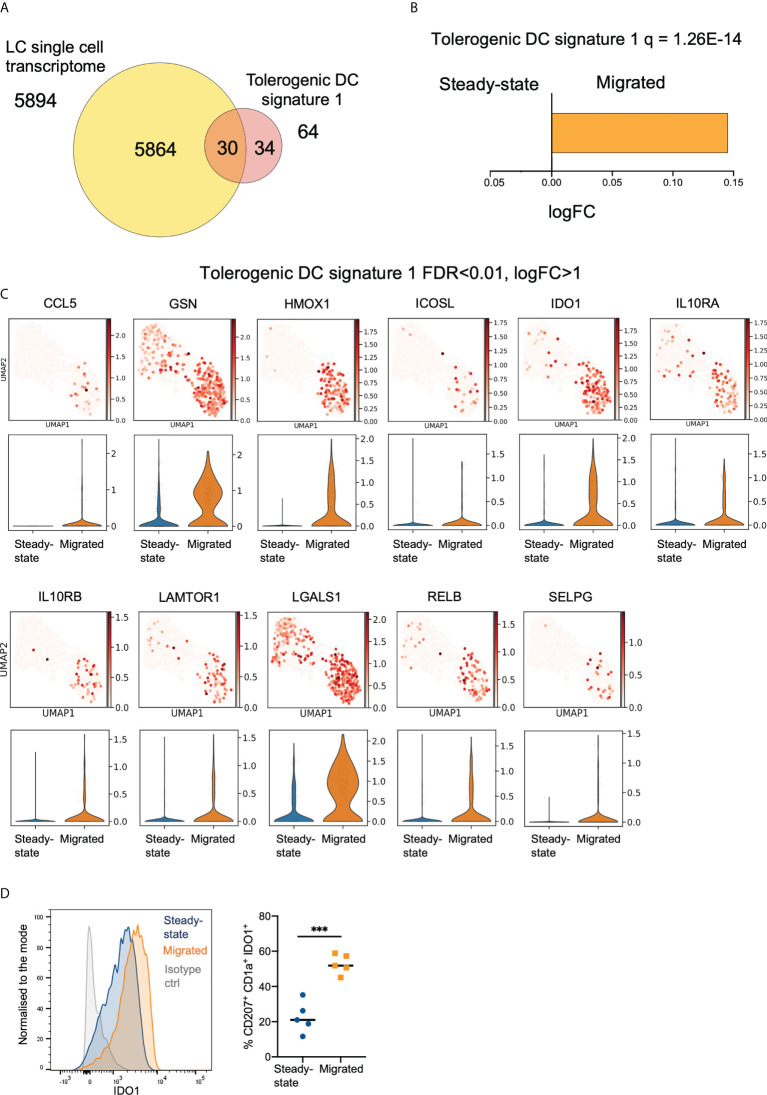
Figure 2.
Migration of LCs from the epidermis enhances their immunoregulatory transcriptional programming. (A) Venn diagram displaying the number of genes from tolerogenic gene signature 1 (tol 1), curated from literature exploring genes associated with DC or macrophage tolerogenic function, within the whole LC single cell dataset. (B) Gene Set Variation Analysis (GSVA) displaying enrichment of tol 1 in the LC populations. FDR corrected p-values and logFC are displayed. (C) Violin plots and UMAP marker plots displaying the expression of genes within tol 1 amongst steady-state and migrated LCs (FDR corrected p-values <0.01, logFC>1). (D) Flow cytometry analysis of IDO1 protein expression in steady-state and migrated LC extracted by 48 hour culture of epidermal sheets. n=5 steady-state and migrated independent LCs versus isotype control (grey), n=4 migrated LCs. ***p<0.001.

