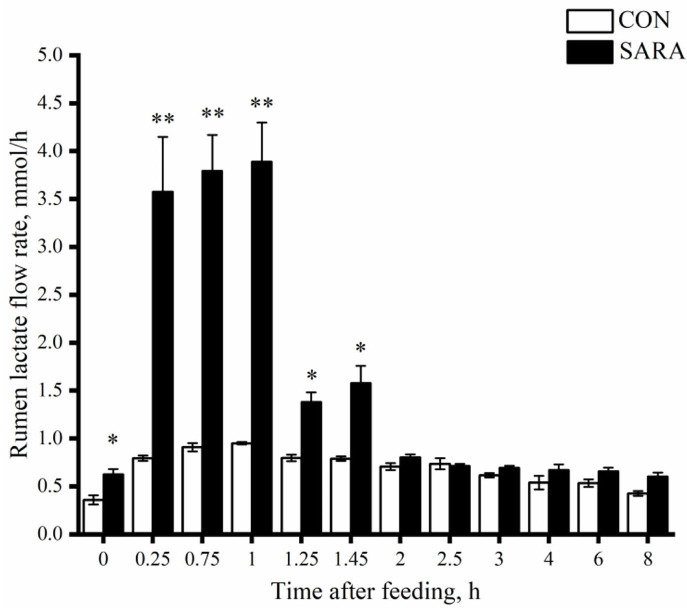
Figure 4.
The dynamic variation of lactate concentration in the rumen fluid of goats under normal (CON) or SARA condition. Data were expressed as mean ± SEM (n = 6). Significant differences are denoted by *P < 0.05, and extremely significant differences are indicated by **P < 0.01. Treatment P <0.065,Time P < 0.002, Treatment * Time P = 0.787.

