
Figure 6.
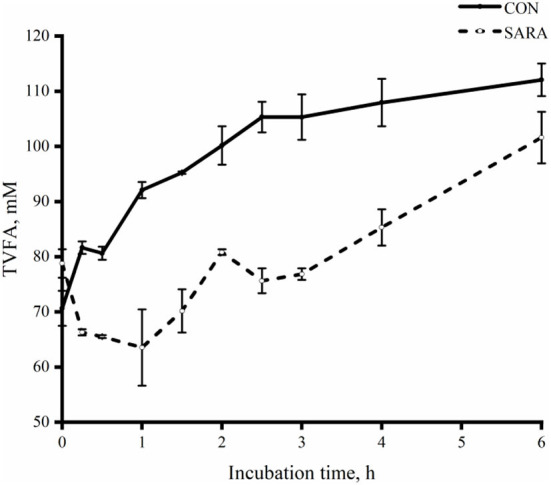
The dynamic variation of total VFA in the rumen fluid of goats under normal (CON) or SARA condition. Data were expressed as mean ± SEM (n = 6). Treatment P < 0.001, Time P < 0.001, Treatment * Time P < 0.001.
Official websites use .gov
A
.gov website belongs to an official
government organization in the United States.
Secure .gov websites use HTTPS
A lock (
) or https:// means you've safely
connected to the .gov website. Share sensitive
information only on official, secure websites.
The dynamic variation of total VFA in the rumen fluid of goats under normal (CON) or SARA condition. Data were expressed as mean ± SEM (n = 6). Treatment P < 0.001, Time P < 0.001, Treatment * Time P < 0.001.