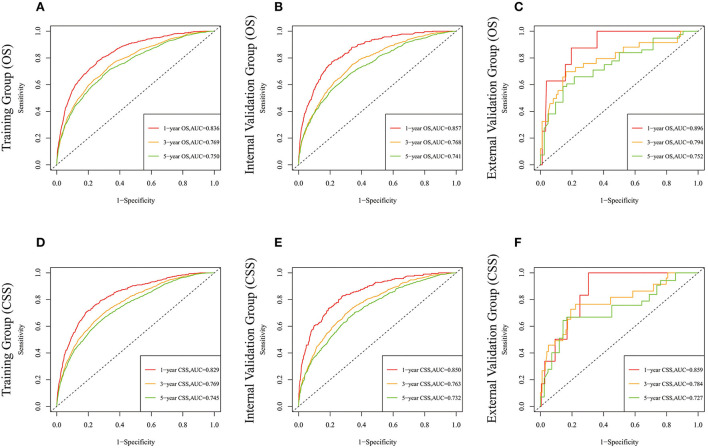
Figure 5.
The time-dependent ROC curves of the nomogram predicting OS at (A) 1-year and 3-year and 5-year in the training cohort, and at (B) 1-year 3-year and 5-year in the internal validation cohort, (C) 1-year and 3-year and 5-year in the external training cohort. The time-dependent ROC curves of the nomogram predicting CSS at (D) 1-year and 3-year and 5-year in the training cohort, and at (E) 1-year 3-year and 5-year in the internal validation cohort, (F) 1-year and 3-year and 5-year in the external training cohort.

