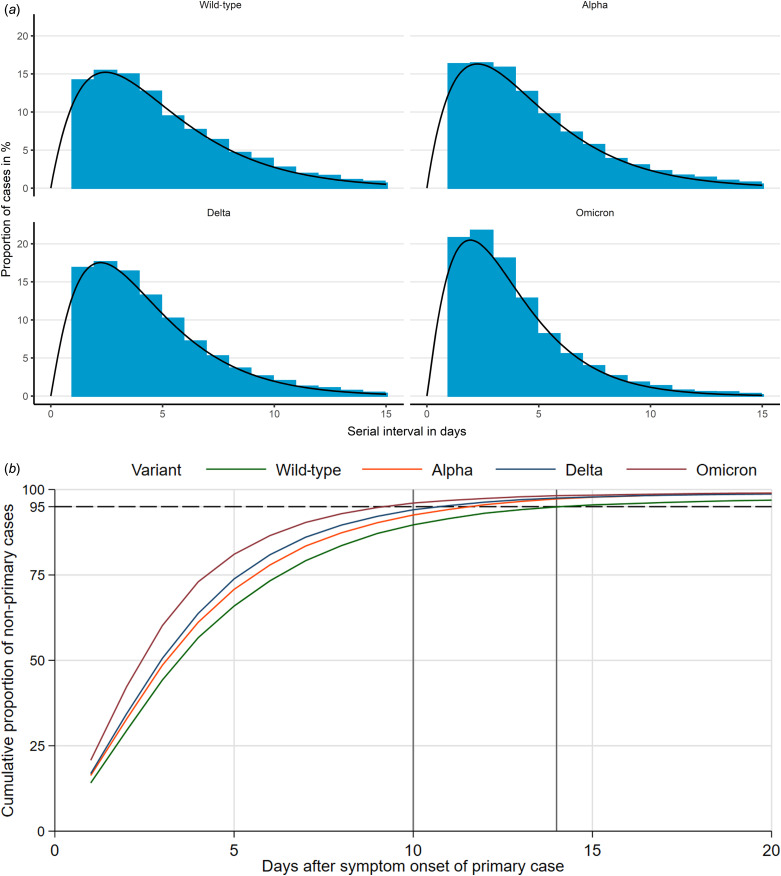
Fig. 1.
(a) Distribution of serial interval from first to secondary cases in households by variant and fitted γ distribution. (b) Cumulative proportion of non-primary cases in households, in days after symptom onset of primary case and by variant; vertical lines at 10 and 14 days, dashed horizontal line at 95%. The estimated parameters for the Gamma distribution were for Wild-type, Alpha, Delta and Omicron respectively shape (2.02, 2.00, 2.11, 2.14) and rate (0.42, 0.44, 0.50, 0.59).

