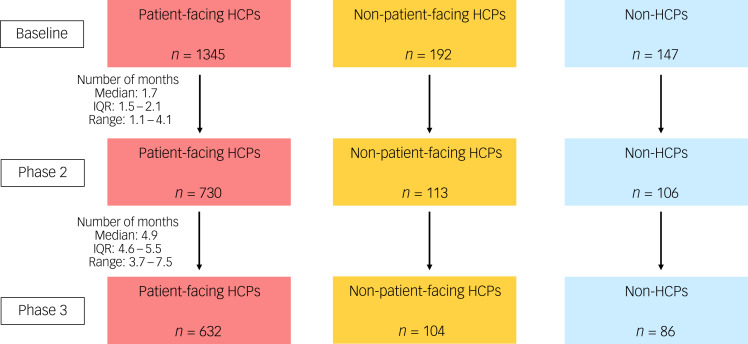
Fig. 1.
Flow diagram for participant numbers. Total numbers of participants at baseline, phase 2 and phase 3 was 1721, 957 and 830, respectively. These numbers are higher than those included in the figure because not all HCPs could be accurately categorised as patient-facing or non-patient-facing HCPs (e.g. the total number of participants at baseline where patient-facing status and HCP status could be identified is 1713). HCP, healthcare professional; IQR, interquartile range.

