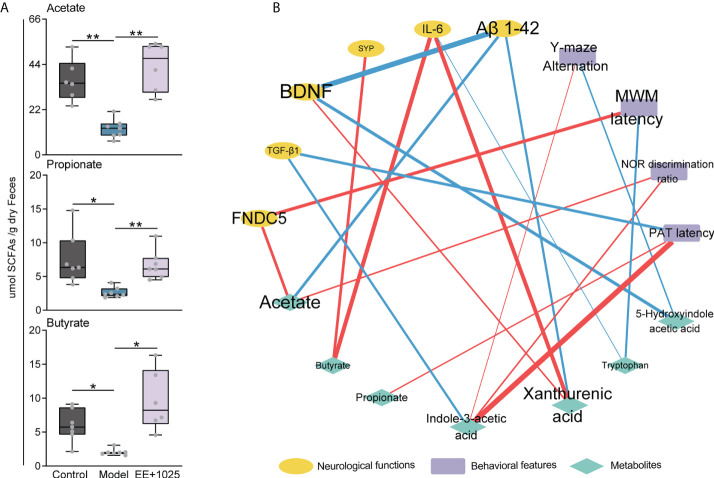
Figure 7.
Integrated analysis reveals that brain function is associated with changes in microbial metabolites. (A) SCFA concentrations in feces. Data are presented as the median ± interquartile range. In the box plot, the bottom and top are, respectively, the 25th and 75th percentile, a line within the box marks the median. Whiskers above and below the box indicate 1.5 interquartile range of the lower and upper quartile, respectively. Each data point represents one independent mouse. *P < 0.05, **P < 0.01 as determined by one-way ANOVA. (B) Spearman correlation network containing behavioral features, neurological data and metabolites. Red edges indicate a positive correlation and blue edges indicate a negative correlation.

