
Figure 3.
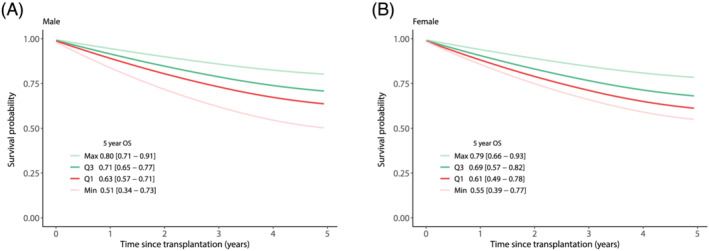
SMI multivariable. Expression of the adjusted coefficient for SMI in terms of survival. The curves are evaluated at the minimum value (min), first quartile (Q1), third quartile (Q3) and maximum (Max) for SMI. Survival was stratified for gender whereas other covariates were set at their mean value. For men that is for SMI: min = 29 cm2/m2, Q1 = 46 cm2/m2, Q3 = 57 cm2/m2, max = 75 cm2/m2. With average age = 56.6 years, BMI = 26.6 kg/m2, Tumour number = 5.4, Tumour size = 42 mm, AFP = 1.4 log10(ng/mL), vascular invasion = 0.4, Meld = 12.8, Child–Pugh points = 6.9, ALBI score = −1.98. For women that is for SMI: min = 29 cm2/m2, Q1 = 37 cm2/m2, Q3 = 47 cm2/m2, max = 65 cm2/m2. With average age = 56.3 years, BMI = 25.7 kg/m2, Tumour number = 7.3, Tumour size = 39.6 mm, APF = 1.5 log10(ng/mL), vascular invasion = 0.4, Meld = 10.6, Child–Pugh points = 6.6, ALBI score = −2.03. The 95% confidence interval of the 5 year overall survival (OS) estimate is displayed between the square brackets. OS, overall survival; SMI, L3 skeletal muscle mass index. Created in R.