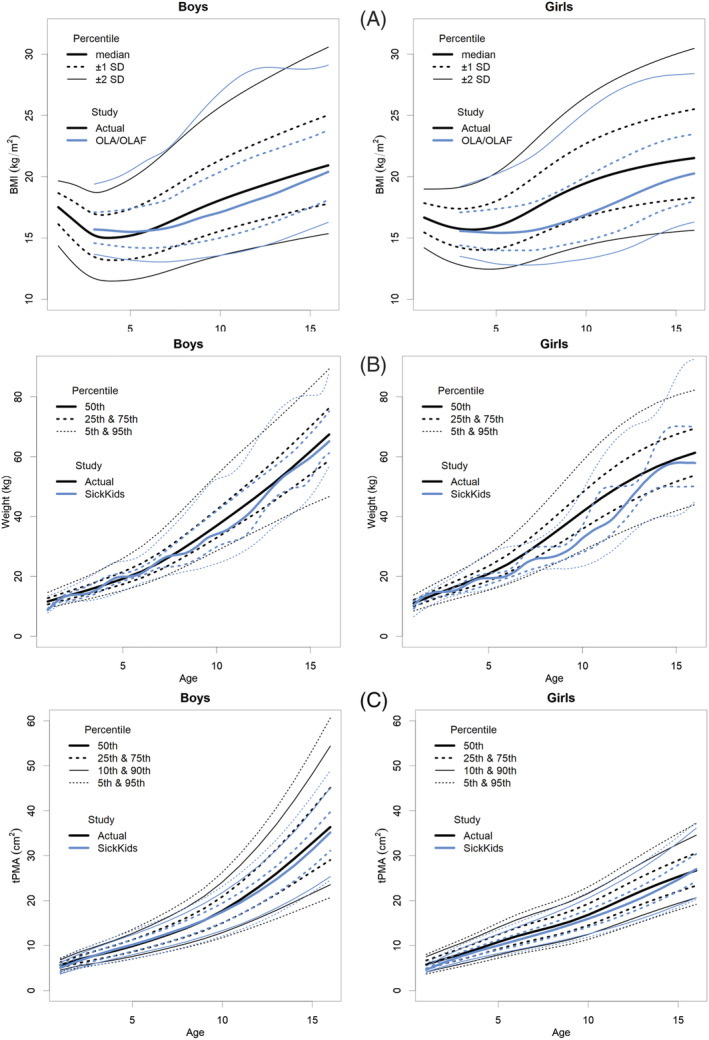
Figure 2.

(A) BMI‐for‐age (kg/m2) SD percentile charts for boys and girls aged from 1 to 16 years of actual study in comparison with national reference standards (OLA/OLAF study). 26 , 27 BMI, body mass index; SD, standard deviation. (B) Weight‐for‐age (kg) percentile charts for boys and girls aged from 1 to 16 years in comparison with weight reference standards published by Eberhard et al. 17 (C) MRI‐derived total‐psoas‐for‐age (cm2) percentile charts for boys and girls aged from 1 to 16 years in comparison with tPMA CT‐derived reference standards published by Eberhard et al. 17 tPMA, total psoas muscle area.
