
Figure 3.
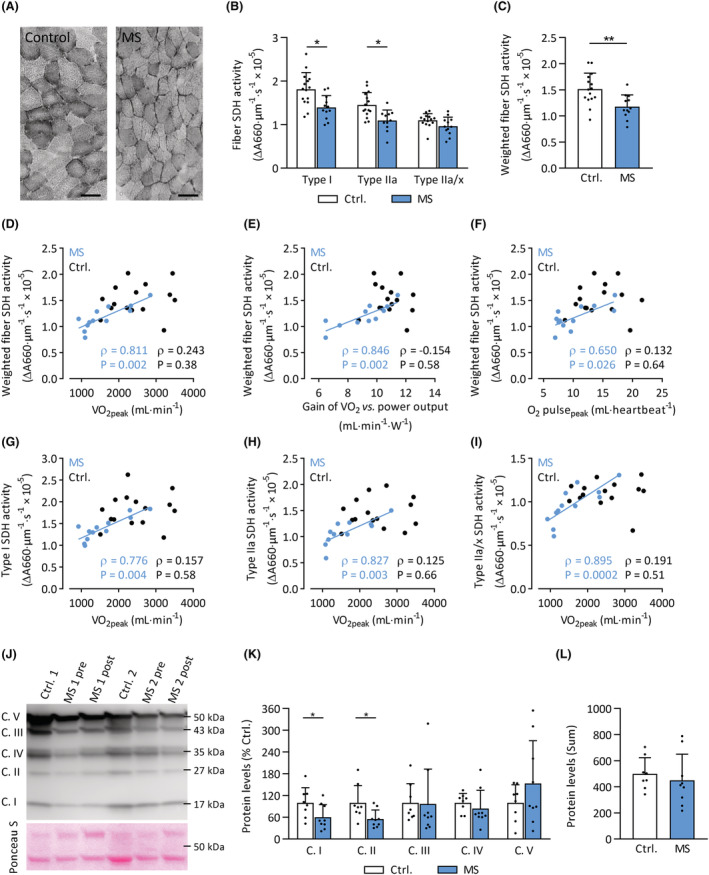
Lower muscle fibre SDH activity and mitochondrial complex I and II protein levels in MS. (A) Grey‐scale images stained for SDH activity from representative MS and control subjects. Scale bar: 100 μm. (B) Fibre SDH activity in type I, type IIa, and type IIa/x muscle fibres of MS patients (blue bars) and controls (clear bars). (C) SDH activity weighted for muscle fibre composition in MS patients (blue bars) compared with controls (clear bars). Relationships between weighted SDH activity and (D) peak oxygen uptake (V̇O2peak); (E) gain of the V̇O2 versus power output relationship; (F) peak O2 pulse (O2 pulsepeak). Relationship between V̇O2peak and SDH activity in type I, IIa, and IIa/x (G–I) in MS patients (blue circles) and controls (black circles). (J) Representative Western immunoblot with subunits for complex (C.) I, II, III, IV, and V protein bands at different molecular weights, and Ponceau S loading control. (K) Quantification of subunits of mitochondrial complex protein levels, relative to controls. (L) Total mitochondrial OXPHOS protein levels in MS and controls, calculated as the sum of individual complexes. *P < 0.05, **P < 0.01. Mean ± SD.