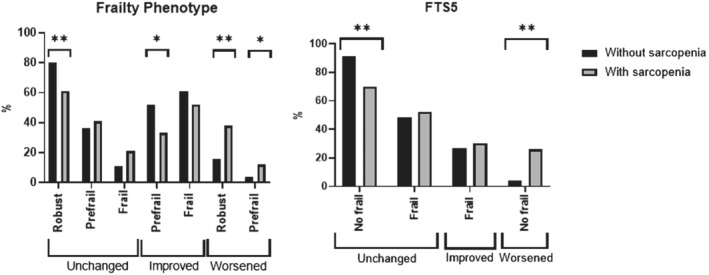
Figure 1.

Rates of transitions in frailty status, assessed by FP and FTS5, according to the presence of sarcopenia. FP, frailty phenotype; FTS5, Frailty Trait Scale 5. *P < 0.005; **P < 0.001. Columns without symbol means non‐significant difference P ≥ 0.05.
