
Figure 5.
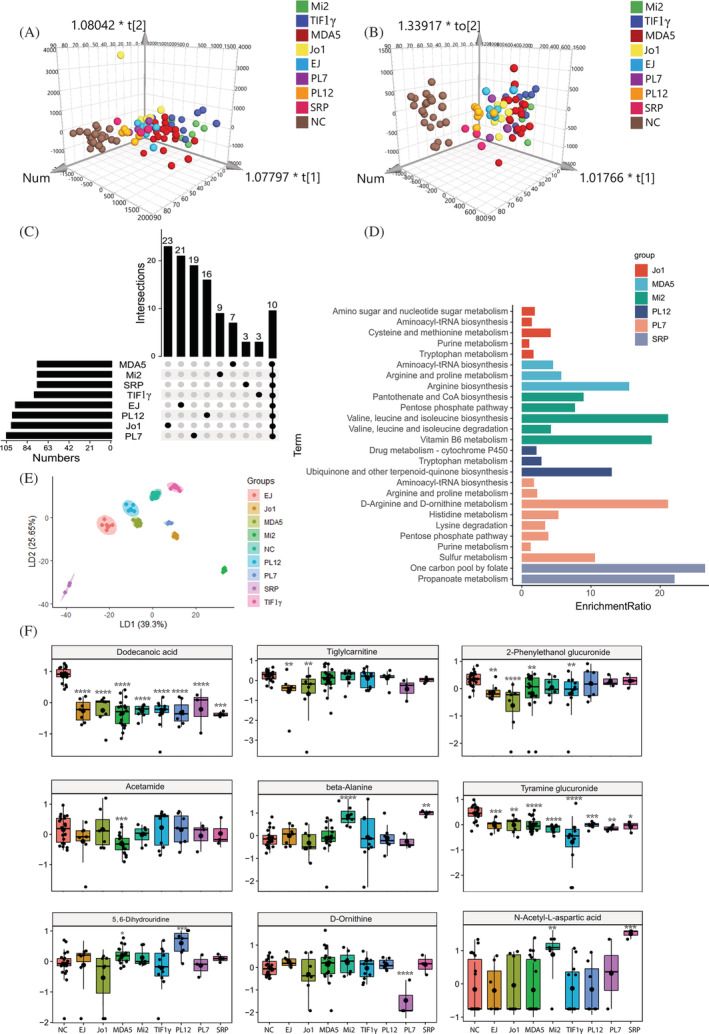
Urine metabolomic profiles in the MSA‐defined IIM subtypes. (A and B) The orthogonal partial least‐squares discriminate analysis (OPLS‐DA) score plots of urine metabolomics data compared anti‐EJ+, anti‐Jo1+, anti‐MDA5+, anti‐Mi2+, anti‐TIF1γ+, anti‐PL12+, anti‐PL7+, and anti‐SRP + IIM patients to normal control (NC) samples in positive (A) and negative (B) ion mode, respectively. (C) The UpSet plot analysis based on the selected urine important metabolites (VIP > 1, FC > 1.2 or <0.83). (D) KEGG pathway analysis of exclusively important metabolites in each IIM subtype. (E) The linear discriminant analysis (LDA) plot based on the top 12 metabolites in the AdaBoost machine model. (F) The most specific metabolites identified by the AdaBoost machine model to classify urine samples from NC, anti‐EJ+, anti‐Jo1+, anti‐MDA5+, anti‐Mi2+, anti‐TIF1γ+, anti‐PL12+, anti‐PL7+, and anti‐SRP+ myositis patients, respectively (P value compared with NC, *, <0.05; **, <0.01; ***, <0.001, ****, <0.0001).