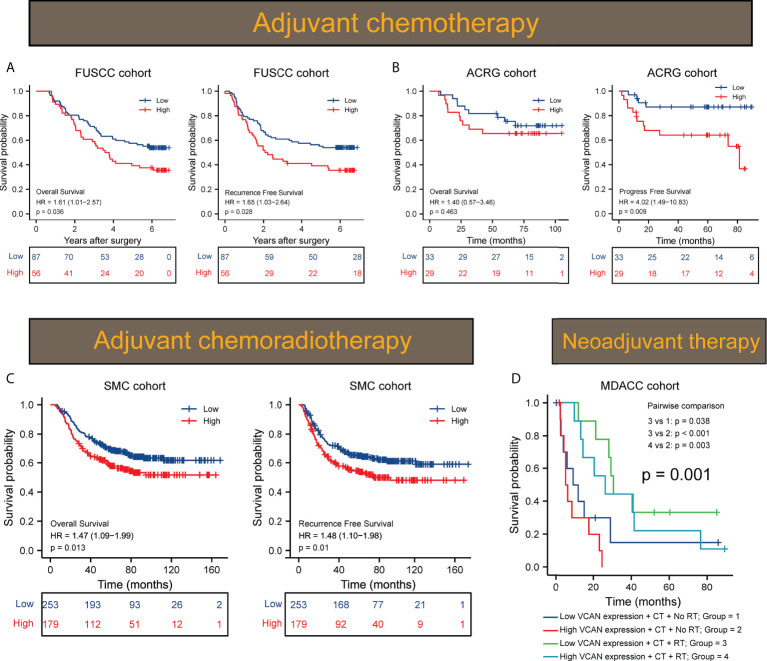
Figure 2.
VCAN expression predicted response to adjuvant therapy in GC. (A) Kaplan–Meier curves of OS and RFS of low VCAN and high VCAN group in patients treated by ACT (n = 143) in FUSCC cohort. (B) Kaplan–Meier curves of OS and PFS of low VCAN and high VCAN group in patients treated by ACT (n = 62) in ACRG cohort. (C) Kaplan–Meier curves of OS and RFS of low VCAN and high VCAN group in patients treated by adjuvant chemoradiotherapy (SMC cohort, n = 432). (D) Kaplan–Meier curves of OS of low VCAN and high VCAN group in patients treated by neoadjuvant chemotherapy or chemoradiotherapy (MDACC cohort, n = 40). CT, chemotherapy; RT, radiotherapy.

