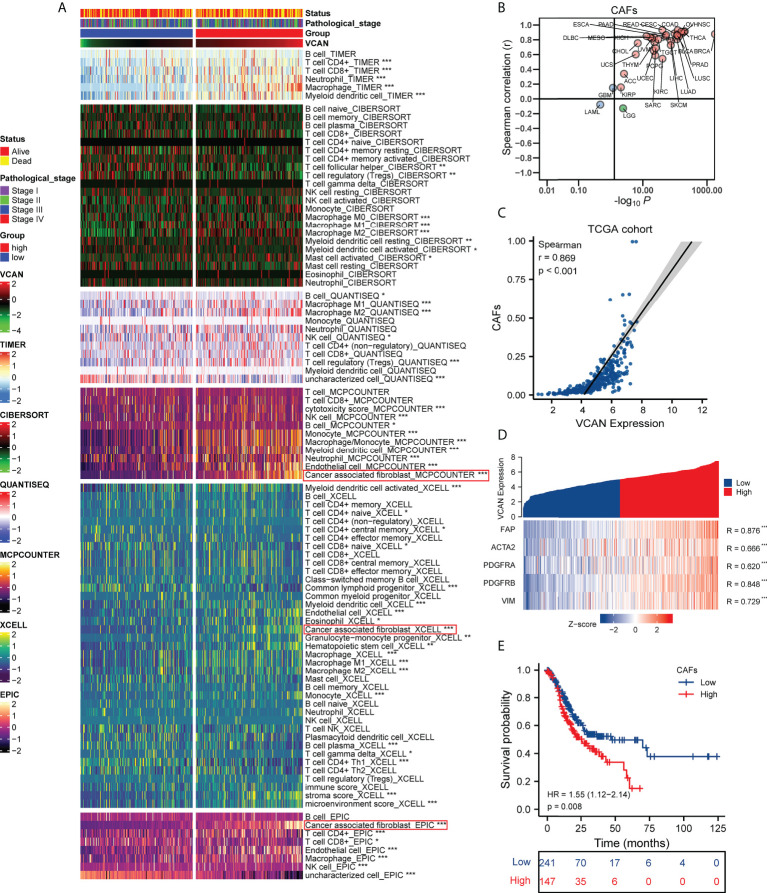
Figure 5.
The correlation between VCAN expression and the tumor microenvironment. (A) The correlation between VCAN expression with the infiltration of immune cells and stroma cells in tumor microenvironment (TCGA cohort). (B) The correlation between VCAN expression with the infiltration of CAFs in human pan-cancer (Pan-cancer Atlas, TCGA). (C) The correlation between VCAN expression with the infiltration of CAFs in patients with GC (TCGA cohort). (D) The correlation between VCAN expression with the expression of CAFs markers in patients with GC (TCGA cohort). (E) Kaplan–Meier curves of OS of low and high group stratified by the CAFs infiltration in patients with GC (TCGA cohort). *p < 0.05, **p < 0.01, and ***p < 0.001. GC: gastric cancer; CAFs: cancer associated fibroblasts.

